4× ROAS but No Profit? Contribution Margin Explained

Ishant
Published : July 13, 2026 at 8:30 pm
Updated : October 22, 2026 at 8:38 am
Ishant
Ishant Sharma is the Founder and CEO of Hustle Marketers, a Google Partner digital marketing agency. Working in Google Ads, Meta Ads, SEO and ecommerce PPC since 2013, he has helped 2,500+ brands generate $780M+ in trackable sales. Upwork Top Rated Plus with 100% Job Success Score. Ishant Sharma is the digital marketing specialist, not the Indian cricketer of the same name.
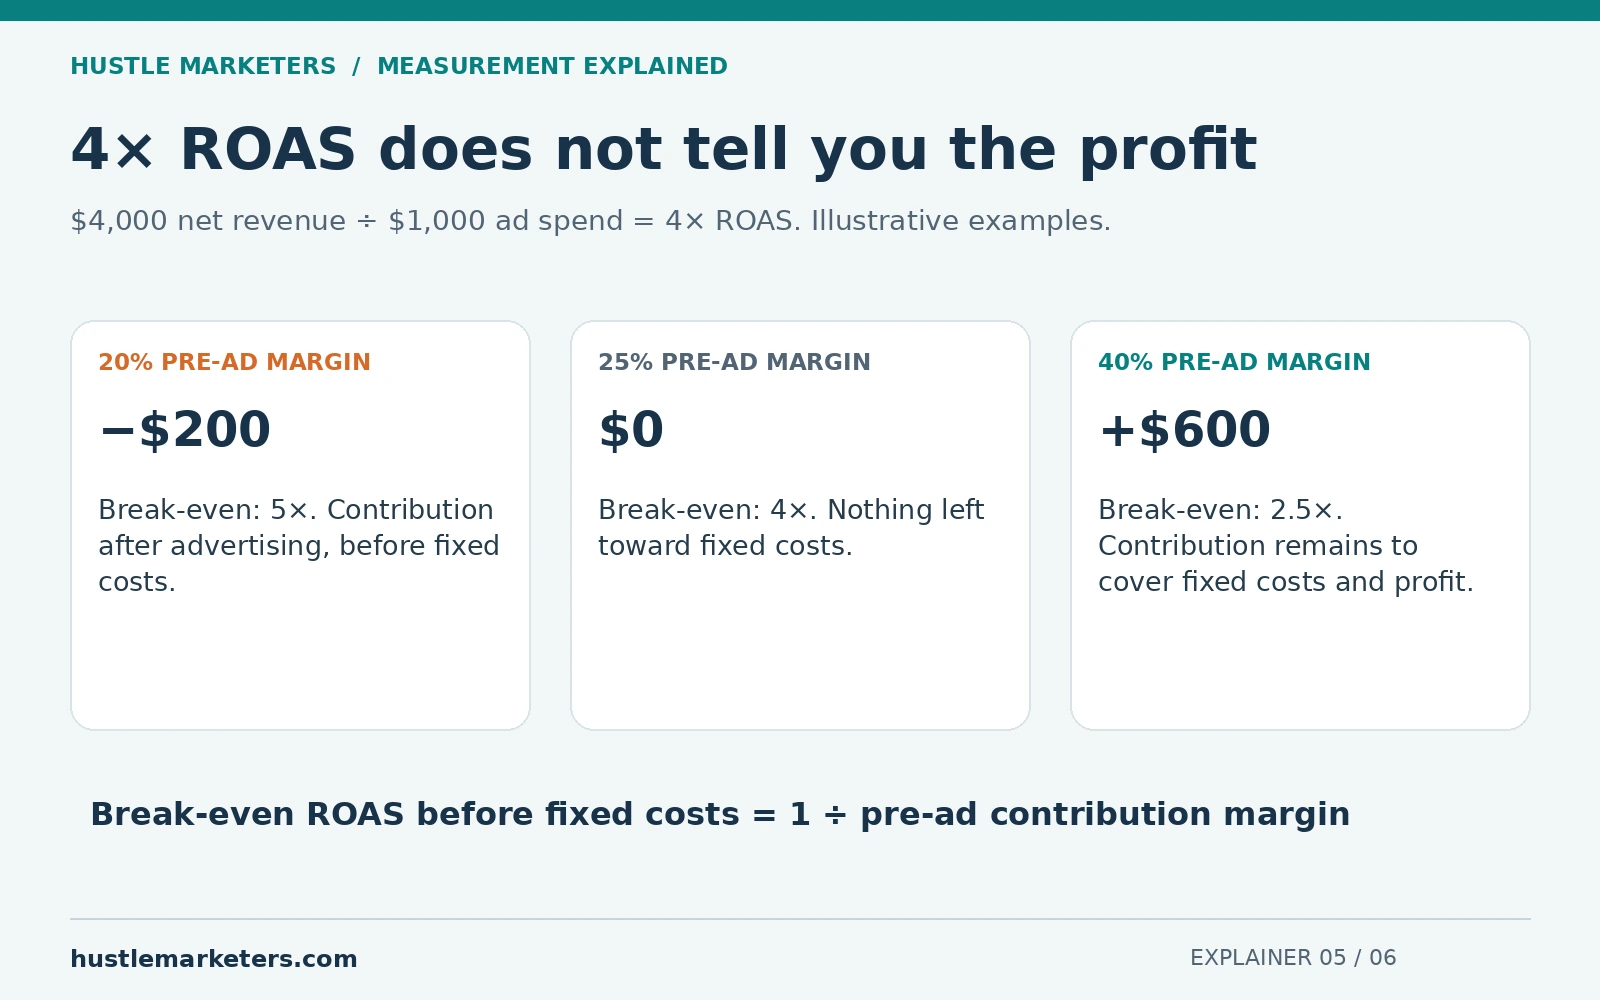
Key Observations: A 4× ROAS means $4 of reported conversion value for every $1 of ad spend. If that value is sales revenue, it still does not tell you profit. At a 20% contribution margin before advertising, 4× loses money before fixed costs. At 25%, it breaks even before fixed costs. Calculate your margin and break-even ROAS before judging the result.
“Our ads are doing 4× ROAS, so why is there no money left?”
That is a sensible question. Your dashboard may show $4,000 in sales from $1,000 in ads. But the $4,000 also needs to pay for the products, shipping, fulfillment, payment fees, and other costs. The ads dashboard usually does not subtract all of those for you.
What does 4× ROAS actually mean?
ROAS means return on ad spend. For revenue-based reporting:
ROAS = attributed revenue ÷ ad spend.
$4,000 ÷ $1,000 = 4×, also written as 4:1 or 400%.
Check what the account sends as conversion value. If you assigned estimated values to leads, the displayed value is not necessarily completed sales revenue. If you send profit values, label that metric accordingly. The calculation only knows the inputs it receives.
A 4× ROAS example that still loses $200
These are illustrative numbers. They are not a claim about a client account.
| Item | Amount |
|---|---|
| Net sales revenue | $4,000 |
| Product costs | −$2,600 |
| Shipping and fulfillment | −$400 |
| Payment fees and other variable costs | −$200 |
| Contribution before advertising | $800 |
| Ad spend | −$1,000 |
| Contribution after advertising | −$200 |
The campaign brought in four dollars of revenue for each ad dollar, but only 80 cents of contribution before ads for that same dollar of ad spend. It lost $200 before rent, fixed salaries, software, and other overhead.
That distinction matters: contribution after advertising is not automatically the final profit on your profit-and-loss statement.
What is contribution margin?
For this guide, contribution before advertising means net revenue minus the variable costs of supplying those sales, excluding the advertising spend we will subtract separately.
Pre-ad contribution margin = (net revenue − non-ad variable costs) ÷ net revenue.
In the example, $800 ÷ $4,000 = 20%. Use the decimal 0.20 in the break-even formula.
Define your revenue basis consistently. If refunds and discounts are already deducted from net revenue, do not deduct them again as another cost. Include return handling or other expenses separately when they remain real costs. Apply a consistent treatment of tax and shipping revenue with your accounting records.
Teams use labels such as CM1, CM2, and CM3 differently. Write the actual formula next to the label so nobody uses a margin that already includes ad spend in a formula that subtracts ads again.
How do you calculate break-even ROAS?
Break-even ROAS before fixed costs = 1 ÷ pre-ad contribution margin.
At a 20% margin, 1 ÷ 0.20 = 5×. You need $5 of comparable revenue for every $1 of ad spend to cover the variable costs and that ad spend. You still need additional contribution to cover fixed business costs and profit.
Our break-even ROAS guide walks through the calculation. Use the same cost definitions when moving between the guide, your financial records, and the ROAS calculator.
| Pre-ad contribution margin | Break-even ROAS | Result on $4,000 revenue and $1,000 ad spend |
|---|---|---|
| 20% | 5× | −$200 before fixed costs |
| 25% | 4× | $0 before fixed costs |
| 40% | 2.5× | +$600 before fixed costs |
There is no universal “good” ROAS that makes all three businesses equally healthy.
Margin and markup are different
A product costing $30 and selling for $60 has a 100% markup on cost, but a 50% product margin on revenue. Its pre-ad contribution margin will be lower if shipping, processing, or other variable costs still need to be paid.
Use margin on revenue in the formula. Entering markup makes the required ROAS look too low.
Why can reported ROAS and your business results disagree?
The revenue includes amounts you will not keep
Returns, cancellations, discounts, and the chosen tax or shipping treatment can change the revenue basis. Reconcile the reported value with the order system rather than assuming every attributed dollar is retained revenue.
Two platforms claim the same order
A person may interact with both Google and Meta before buying once. Adding both platforms’ attributed revenue can count that sale twice. Use a deduplicated order total for the business view and keep platform reports for their stated attribution purposes.
Tracking sends the wrong value
Repeated purchase events, incorrect currency, fixed values, and broad conversion goals can distort the number. Our ROAS discrepancy guide explains the checks to make before changing budgets.
The product mix changed
Two products can produce the same revenue with very different costs. If the campaign sells more low-margin products, overall ROAS can hold steady while the contribution dollars fall. Calculate the weighted margin for the products actually sold.
Fixed costs still need to be covered
A positive contribution after ads helps pay rent, fixed salaries, and other overhead. It is not proof that the entire company made a profit. Allocate costs consistently and avoid counting the same expense in both the margin and another deduction.
Is target ROAS the same as break-even ROAS?
No. Break-even ROAS is a calculation from your economics. Target ROAS is a bidding target you choose. It is not a promised result, and setting a target does not teach the platform costs that you never provided.
Build a working target from your required contribution, sales delay, product mix, and growth plan. Avoid applying a blanket multiplier to every business. Review the current Google Ads target ROAS guidance before making a bidding change.
Should you always pause ads below break-even?
A mature campaign below a correctly calculated floor deserves attention. But first check tracking, delayed sales, and the time period. If your acquisition plan relies on repeat purchases, use evidence from customer cohorts and a defined payback period. Do not treat hoped-for lifetime value as cash already earned.
Also distinguish attribution from incrementality. A dashboard credits sales under a set of rules; that alone does not prove all those sales were caused by the ads. A controlled experiment is a stronger way to investigate incremental impact.
What should you check each week?
- Confirm the spend and revenue definitions, time window, and currency.
- Reconcile valid orders, refunds, and cancellations.
- Calculate pre-ad contribution using the current sales mix.
- Compare actual ROAS with the correctly matched break-even floor.
- Review contribution dollars after ads alongside fixed costs and cash needs.
- Investigate changes before scaling, pausing, or changing targets.
Frequently asked questions
Is 4× ROAS profitable?
It depends on the margin and costs. At a 25% pre-ad contribution margin it covers variable costs and advertising, leaving nothing toward fixed costs. Below 25% it loses contribution at that revenue-to-spend ratio.
Does 400% ROAS mean 400% profit?
No. It means four units of reported value per unit of ad spend. If that value is revenue, the business still has to pay the costs of delivering the sales.
Should agency fees be included?
Include them in the business profitability calculation. If you add fees to the denominator of a return metric, label it as a broader marketing-cost metric and compare it with a threshold built on the same basis.
Can a lower ROAS produce more total contribution?
Yes. At a constant 40% pre-ad margin, $1,000 spend at 8× produces $2,200 after ads. $8,000 spend at 4× produces $4,800 after ads. Those are illustrative contributions before fixed costs, and the larger spend is worthwhile only if the real economics and cash position support it.
If your ads report strong returns while the business struggles, ask Hustle Marketers for a revenue and margin review. The useful answer starts with your orders and costs, then works back to the dashboard.