Black Friday Marketing Strategies 2026: Google Ads, Meta Ads, and Advertising Calendar

Ishant
Published : August 2, 2023 at 6:56 pm
Updated : June 7, 2026 at 4:57 am
Ishant

Summarize this blog post with:
Black Friday Advertising: Google Ads and Meta Ads Strategy for the Peak Season
Black Friday advertising is the highest-competition, highest-CPC period of the year for most ecommerce categories. CPCs on Google Shopping typically rise 30 to 50% in the two weeks surrounding Black Friday as every competitor increases bids simultaneously. The brands that win are not the ones who bid most aggressively in the final days. They are the ones who prepared their campaigns 6 to 8 weeks in advance.
Google Ads Black Friday Strategy
- Increase budgets 4 to 6 weeks before Black Friday: Do not wait until November to increase budgets. Shopping campaigns need time to re-enter the learning period and stabilise at new budget levels. Increase weekly budgets by 20 to 30% in early October, then again in early November. By the time peak CPC season arrives, your campaigns have already settled into the new budget range.
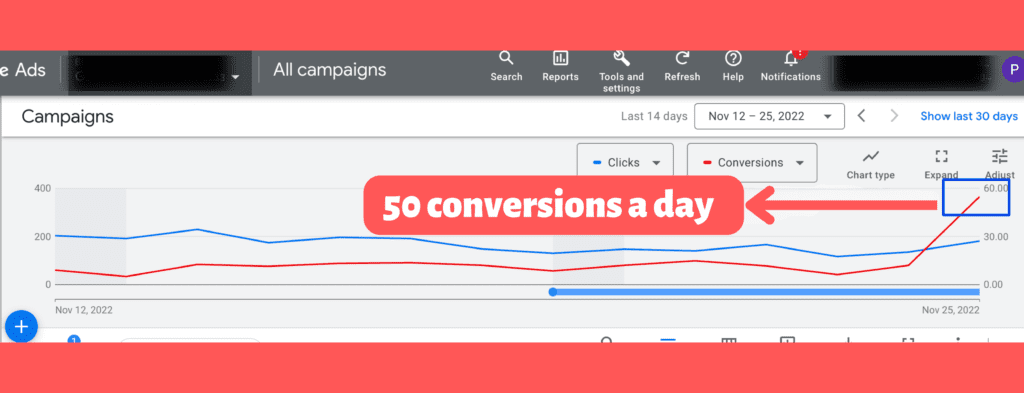
- Switch to Target ROAS bidding if conversion volume allows: Manual bidding or Maximize Clicks during peak season means your campaigns cannot respond dynamically to real-time auction pressure. Target ROAS bidding adjusts bids second-by-second based on conversion probability. If your account has 50+ conversions per month, switch at least 60 days before Black Friday to allow the algorithm to learn at the new budget level.
- Create dedicated Black Friday ad copy: Write RSA headlines that reference the offer explicitly: “Black Friday Sale Ends Sunday,” “40% Off Site-Wide Black Friday,” “Free Shipping Ends November 30.” Generic ad copy during Black Friday gets lower CTR because shoppers are actively comparing offers. Urgency and specificity in headlines drive click share during peak period.
- Expand negative keywords before the season: Run a thorough search term review in October and add negatives for any irrelevant queries that have spent without converting over the past 90 days. Peak season is the worst time for negative keyword gaps to appear because CPCs are at their highest.
Meta Ads Black Friday Strategy
- Build retargeting audiences before October: Meta Ads retargeting performs best when audiences are warm. Set up website visitor audiences (30-day, 60-day, 90-day) and product viewer audiences in September so they have large enough populations to target effectively by November. Small audiences produce insufficient reach for Black Friday scale.
- Use Advantage+ Shopping Campaigns for Black Friday product ads: Advantage+ Shopping (Meta’s automated campaign type for ecommerce) has consistently outperformed manually targeted campaigns in peak season performance. Use it alongside manually targeted retargeting campaigns rather than replacing retargeting entirely.
- Run a teaser campaign starting two weeks before: “Black Friday deals coming November 29 — sign up for early access” email capture campaigns run on Meta two weeks before the event build a warm audience that converts at 2 to 3x the rate of cold traffic during the sale itself.
Black Friday Marketing Calendar: When to Do What
- August to September: Finalise product offers and discounting strategy. Identify top-performing products from the previous year. Confirm inventory levels for promoted SKUs. Build email lists and SMS subscriber bases before the season.
- October: Begin budget increases on Google Shopping and PMax. Launch teaser campaigns on Meta to build warm audiences. A/B test Black Friday ad copy variants to identify top performers before peak season.
- First two weeks of November: Launch early Black Friday promotions for email subscribers. Increase paid social budgets. Finalise all landing pages and test page load speed under simulated peak traffic.
- Black Friday week: Maximise budgets. Monitor campaigns twice daily. Respond to performance anomalies quickly. Keep customer support staffing matched to expected order volume.
- Cyber Monday through Cyber Week: Extend offers or refresh with new creative. Many categories see Cyber Monday outperform Black Friday in total order volume. Do not cut budgets after Black Friday ends.
- December (post-peak): Reduce budgets gradually rather than abruptly. Review which campaigns and offers performed best. Document learnings for next year before the data fades from memory.
Black Friday Marketing has become the ultimate battleground for retailers and e-commerce companies. Just imagine: you have customers who are eager to make a purchase. All you need to do is plan your marketing effectively, and boom, you’ll deliver maximum sales for the month. This is what Black Friday shopping brings to the play.
So, all brands and online store owners, the time is round the corner and it’s time to compete hard to win the attention of high-intent shoppers seeking unbeatable deals. During these days, black friday marketing experts are the ideal pick who can help you set sales records, boost conversions, and enhance brand recognition for months to come.
Today’s generation of Consumers is better informed than ever, browsing across multiple retailers and comparing offers quickly. But choosing a full-stack marketing expert like Ishant Sharma of Hustle Marketers shows the way.
Start by optimizing your site to secure a spot in search engine rankings by creating irresistible product offers; every step counts. Here, we will walk you through the 12 best Black Friday Marketing strategies for 2026.
What is Black Friday?
Black Friday is considered the start of the big holiday shopping season in the U.S. and has evolved into the largest shopping event of the year. This is that time of the year when most buyers seek to maximize their shopping potential. During this season, merchants offer steep discounts in order to increase sales and improve profits.
Why Black Friday Happens:
- Creates urgency and FOMO (Fear of Missing Out) among buyers.
- Many people start shopping before the holidays
- Stores try to clear out and refresh their product selection
- Form of incentive to drive brand awareness and customer acquisition
- Opportunity for shoppers to grab exclusive deals and discounts
Importance of Black Friday Marketing for Businesses
Black Friday Marketing have a major impact on company sales and brand awareness. With effective Black Friday marketing strategies in action, you can break all records and exceed your sales milestones. Here are the main reasons Black Friday marketing matters for businesses:
- Targets High-Intent Shoppers: Black Friday is the best time of year to convert customers who are actively shopping for goods and services.
- Enhance Short-Term Revenue: Achieve high sales volumes within a limited time period.
- Enhances Brand Visibility: Marketing promotes your brand and keeps it at the forefront of your customers’ minds.
- Encourages Repeat Customers: Making specific offers for individual customers can help them become repeat customers.
- Drives Website Traffic: Delivers new and repeat visitors through well-timed campaigns.
- Enhances Customer Loyalty: Marketing campaigns that resonate with your customers will increase your sales.
- Supports Multichannel Campaigns: Campaigns can be implemented across multiple channels, including email, social media, and more.
So, as you prepare to dive into the world of Black Friday marketing, remember that success lies in crafting a compelling strategy that captivates your audience, stands out from the competition, and drives customers to choose your business over others.
Read more about ecommerce PPC and mastering the art of driving more sales.
12 Best Black Friday Marketing Strategies 2026
There’s no single black friday marketing strategy that rules; you need to try the best combination that boosts awareness and converts. Here, we have compiled the best marketing strategies, along with case studies, to help you demonstrate the power of Black Friday marketing.
1 – PPC Advertising
Pay-per-click advertising is one of the leading Black Friday marketing strategies to drive quality traffic and conversions. With PPC advertising, you can reach high-intent shoppers immediately, measure ROI precisely, and adjust campaigns in real-time.
Ad tips:
Use visually compelling creatives to stand out in crowded search results.
By choosing Ishant Sharma as your PPC management expert, you can boost sales during Black Friday. He has implemented cross-channel retargeting for BigCommerce brands, such as Armorpoxy, by running Meta Ads, Google Ads, and others, helping them convert more during Black Friday.
- Begin Ad campaigns early, a week or two before black Friday.
- Advertise teasers, bestsellers or exclusive offers to get noticed.
- Highlight promotions in Google Shopping Ads with dynamic sale badges like “12% Off” or “Limited Offer” to boost click-through rates.
- Assign each ad a unique Promotion ID that will indicate which ad is attracting the highest number of buyers.
- He targeted consumers who previously scrolled but didn’t turn, showing them personalized ads featuring the products they explored, paired with urgency messaging like “Offer Ends in 24 Hours. This led to an increase in the chances of making the purchase.

2. Optimize Your Site for All Devices
Before jumping into Black Friday marketing, you need to address the root cause: start optimizing your website across all devices. Quick-loading, smooth, and responsive websites are all that matter to get Black Friday shopping event clicks for you.
Shopping? Even adding a cart is a later thing. If the website lags, is not mobile-friendly, or takes too long to load, customers will instantly bounce back to your competitors. Today, mobile traffic drives 60% of the ecommerce sales, so optimize better and win the league.

Steps you can take:
- Use a design that looks right on any device
- Cut down page wait times; every second makes a difference
- Make finding products easy with clear menus
- Place buttons to buy items where everyone can see them
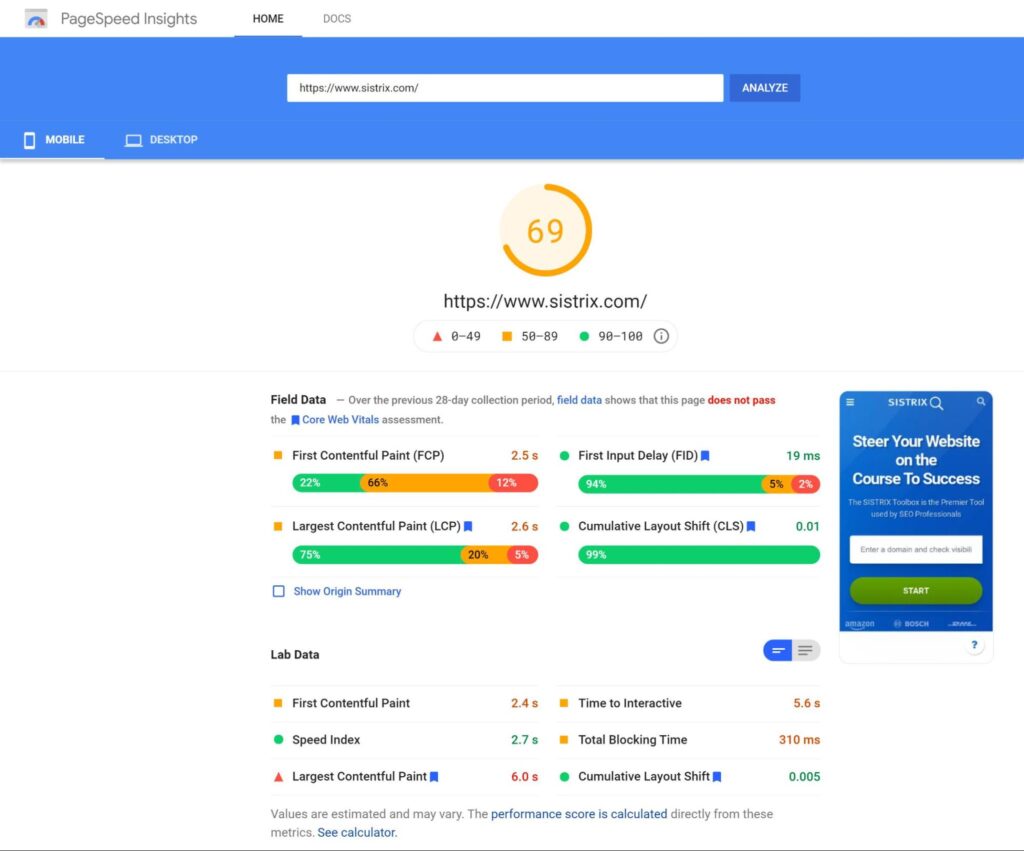
Tip: Use tools like PageSpeed Insights to check the performance of your website on Both Desktop and Mobile Devices.
For example, Ishant optimized Armorpoxy’s website for mobile versions’ load time by 40% before the Black Friday rush, resulting in an over 22% improvement in mobile conversions.
3 – Plan Your Black Friday Email Marketing Campaign
Email marketing is one of the most effective and authentic ways for black Friday marketing. Millions of emails are sent during Black Friday, offering a last chance to grab 40% off on exclusive footwear.
It’s your time to implement an email marketing campaign and dive into the waters of sales for your store. Email remains a powerful way to encourage people to make purchases on Black Friday. The message is most effective when it’s targeted, personal, and delivered at the right time.
Tips to follow while implementing email marketing campaigns during black friday:
- Organize your list based on past buys or people’s interests
- Catchy subject lines help get emails opened, like “Last Chance to grab best Deals!”
- Add in holiday touches so messages feel special
- Try out different subject lines or formats to see what people respond to most

Examples of black Friday email Marketing campaigns led by our Clients
Universal Nail Supplies
Universal Nail Supplies captures customer attention with eye-catching subject lines that prompt customers to click and take action. They used the following phrases as suggested below to improve open rate to boost sales during Black friday:
- Sale
- Offer
- 15% off
- Free shipping
- Markdown
- Closeout
Here’s a clear real-time scenario for you by Universal Nail Supplies:.
Armorpoxy
Armorpoxy sales surged after we implemented a thoughtful email marketing campaign, helping them stand out. Here you can see the combination of personalized messaging, an attractive design, and clear offers that drive attention and boost conversions.


4 – Create a Sense of Urgency and excitement
Shoppers not only want good deals, they also act when there’s urgency. Tapping into the fear of missing out prompts people to buy more quickly than usual.
Ways to build urgency:
- Show updates like “recent purchase” or “trending item” to make people feel part of something busy
- Place countdown clocks in emails and on the site to show what time is left
- Show warnings when stock is running out, like “only 3 left”
- Use language that tells people to act now, such as “Ends Today”
- Give special deals for those who shop early
Example: One entrepreneur, Marcus Taylor said that creating a sense of urgency helped him drive double sales by 332%.

Want to know the importance of ecommerce marketing? Read here to know.
5. Social Media Marketing
Social media marketing creates the buzz among audiences about the black Friday event. This Black Friday marketing campaign is the heartbeat of the shopping season, urging more buyers to purchase and drive sales.
During the black season, shoppers scroll for the best deals, sneak peeks and exclusive offers. To turn visitors into customers, you need a strong social media marketing strategy. Strong social media marketing helps you reach products to potential buyers at the right time.

Steps to implement game-changing Black Friday social media marketing:
- Teasers and sneak peeks: Share sneak peeks of upcoming offerings, limited-time offers, or upcoming product launches to build anticipation and excitement.
- Influencer collaborations: Leverage niche influencers to enhance the credibility of your campaign and expand your reach to a wider audience.
- Engaging visuals: Display products and deals using high-quality images, GIFs, or short videos.
- Contests and giveaways: Run interactive contests related to Black Friday deals to engage and promote engagement.
- Platform-specific shopping features: Seamlessly buy products through Instagram Shopping, Facebook Shops, and TikTok product links.
- Live streams: Demonstrate your product or conduct a live Q&A session to create a sense of urgency and excitement in real-time.

Use these social media tactics to boost your Black Friday sales.
6 – Create an Irresistible Offer
A Black Friday offer has to stand out from the rest. The discount or deal should feel special and worth purchasing immediately.
Offer ideas to consider:
- Bundle complementary products
- BOGO (Buy One, Get One) or layered discounts for bigger purchases
- Free shipping or free gift thresholds
- Early access deals for subscribers or loyalty members
Here’s your guide to Ecommerce digital marketing to drive potential sales for your business.
7. Audit Product Pages
An optimally designed product page helps guide shoppers in making a purchase decision. Images, texts, and buttons are important.
Here’s the checklist that you need to follow to audit product pages and maximize conversions:
- Enhance the overall appeal of the product by featuring high-quality product images from every angle, highlighting key USPs, and showcasing customer benefits. Well-written product descriptions with full clarity of features can help in the decision-making process.
- Always ensure that the product description is up-to-date. This helps you ideally reflect the product features, benefits and value.
- Categorize the product based on the purpose. For example, you can create categories like “gifts for her” or “gifts under $100.” This helps customers easily navigate and choose the products.
Ishant Sharma of Hustle Marketers, a full-stack marketer, helped Armorpoxy enhance their product presentation by grouping and updating images. This improved engagement rate, boosted conversion and sales.

Do you wish to advertise on Bing but don’t find the right strategies to implement? Here’s your complete guide to Bing advertising.
8 – Leverage the Buy Now, Pay Later Feature
Buy Now, Pay Later” (BNPL) is a great Black Friday Marketing strategy that urges more and more customers to make a purchase. This allows customers to split payments over time, making high-value purchases more accessible and reducing the cart abandonment rate.
Those stores employing this strategy during the Black Friday event can convert customers with a limited budget into purchasers.
How to make the most of BNPL:
- Team up with well-known payment partners like Klarna, Afterpay, or Affirm
- Highlight instalment options clearly on product pages and at checkout.
- Feature the BNPL benefits in the marketing campaigns, banners, and emails
- Combine BNPL with limited-time deals ending soon that create urgency and drive immediate action
Merchants offering BNPL options saw a quarter more sales compared to those who didn’t during the big holiday rush.

– Focus on Your Abandoned Cart Rate
The cart abandonment rate increased during the Black Friday sale. Since customers continue to get deals from multiple merchants. Therefore, it is important to plan an effective Black Friday marketing campaign.
Here are strategies to follow to cut down the cart abandoned rate:
- Send automated follow-up emails with exclusive discounts.
- Include clear cost breakdowns upfront
- Use social proof and customer reviews to build trust
10 – Use SMS Marketing
SMS is a straightforward method of notifying shoppers during Black Friday. Unlike email, which can often get lost in crowded inboxes, SMS messages reach mobile devices directly, improving search visibility.
Over 90% of the SMS messages are read within minutes, improving the chances of getting your product noticed.
During high-intensity shopping periods, such as Black Friday, timely and concise SMS alerts can result in a significant increase in sales. It is best suited for flash sales, last-minute deals, and abandoned cart reminders.
Ways to do it well:
- Combine SMS campaigns with email or social media for a multi-channel push
- Messages should be concise, and the main offer must always be clearly stated.
- Include a clear action, such as Shop Now or Grab 50% Off Before Midnight.
- Segment audience to send personalized offers based on past purchases or browsing behavior.
- Use urgency triggers, such as a countdown or a notification indicating only a few items left.
11 – Optimize Product Feed with Promotion ID and Discount Codes
A good product feed shows the deals on the screen and can be easily spotted wherever a person is shopping.
At Hustle Marketers, Ishant Sharma successfully implemented a strategy for one of the brands, such as Armorpoxy, showcasing a 12% discount badge with an easily redeemable code and a countdown for expiration. This helped them boost click-through rates and achieve significant conversions by creating a sense of urgency and providing a seamless shopping experience.
Tips to implement this strategy and witness quality results:
- Tag products with Promotion IDs for easy tracking
- Clearly showcase discount badges or limited time offer
- Put timers to remind shoppers of expiring deals
- Check presentation works well on both phones and computers
Looking to drive attention to your Google Shopping feed? Here is a complete guide to supercharging your Google Shopping feed.
12 – Add New Products Just Before Black Friday
Launching new products just before Black Friday can stir up excitement and attract attention from loyal customers.
Tips to build awareness regarding the new launch:
- Send emails or post on social media, teasing new launches
- Give a behind-the-scenes insight into product development in articles or videos.
- Create exclusivity by clearly indicating that limited quantities of products are available.
Vessi announced future releases of sneakers on Instagram, which resulted in pre-orders, despite Black Friday not having been released yet.

By implementing these 12 practical Black Friday marketing strategies, you’ll be well-equipped to maximize your sales and outshine the competition. But the journey doesn’t end here. The following section explores a real-life case study of a successful Black Friday marketing campaign. Get inspired and motivated as we delve into a remarkable success story that will fuel your Black Friday ambitions.
Top Black Friday Marketing Case Study
It’s the ultimate test of how brands can leverage timing and promotion mechanics to trigger impulse purchases during Black Friday. The following two successful Black Friday activations powered by Hustle Marketers demonstrate how effective execution can boost ROI and sales.
Case Study 1: Armorpoxy
Armorpoxy, a leading flooring brand, partnered with Hustle Marketers for a Black Friday promotion centered on visibility, urgency, and structured ad campaigns.
Key Strategies:
- Promotion Badge Integration: Set an urgency countdown timer and add 12% OFF discount tags to Shopping and Performance Max campaigns.
- Segmentation of High-Intent Buyers: Attracted repeat customers and commercial buyers who had previously interacted with the product pages.
- Timed Campaign Bursts: Delivered “Black Friday Preview” ads early in the day, followed by full-sale activations during peak sales time.
- Value-Based Messaging: Emphasizing durability and cost-effectiveness as well as the discount to justify purchase decisions for B2B customers.
Result: Significantly higher click-through rates and improved conversion rates.
Case Study 2: Dylan Patisserie
Dylan Patisserie, a premium gifting and cake brand, wanted to maximize holiday gifting by generating rapid conversions during Black Friday.
Key Strategies
- Emotion-Led Copywriting: Black Friday buyers were promised a limited-time gifting opportunity through the creatives.
- Localized Intent Targeting: Advertised to city-specific audiences in search of “order cake near me Black Friday” and “gift delivery deals.”
- Limited-Time Offer Hook: Encouraged quick checkout by deploying time-bound ads for holiday gift bundles.
- High-AOV Bundle Promotion: We launched a Black Friday combo box promotion to increase average order value during peak traffic.
Result: Increased conversion rates and order frequency during evening time slots, indicating gift-buying behavior
Case Study 3: Hobby store
During Black Friday’s peak, Hustle Marketers rebuilt this hobby store’s ads ecosystem in order to reach peak-intent shoppers. A new, aggressive seasonal scaling strategy was implemented to increase product page depth, improve search engine rankings, and refine search signals. It resulted in higher sessions, stronger engagement, and high-value conversions without wasting ad spend.
Key Strategies
- Expansion of seasonal keywords for Shopify collections and products
- Scaling with Google Shopping + high-intent
- Upgrades to mobile UX and checkout for CRO
- Layers for retargeting warm traffic
- A/B testing of offers and creatives
- Peak-conversion-hour bid automation
Results
- +63% increase in total sales
- +41% increase in orders
- +22% lift in conversion rate
- +16% increase in sessions
- Massive improvement in ROAS
Boost Your Business Sales with Black Friday Marketing with Hustle Marketers
Black Friday can be both a challenge and a huge chance to grow. With full-stack marketing experts like Ishant Sharma on your side, it’s easier to cut through the noise. As a white label partner, he worked on building unique campaigns that combine analytics and creativity for their clients. Whether it’s PPC campaigns or streamlining product data, his focus has always been on capturing attention and boosting sales for brands.
Full Stack Marketing Expertise
Led by Ishant Sharma from Hustle Marketers, brings full-stack marketing expertise to e-commerce stores. For example, Armor Garage experienced a 27% increase in revenue after implementing Google Ads, social retargeting, and email campaigns.
By combining several channels and monitoring results in real-time, he achieved higher conversions while also controlling ad spend.
White Label Partner
Sometimes, brands want expert support without showing it’s being handled by someone else. As a white label partner, Ishant Sharma of Hustle Marketers has managed entire Black Friday marketing campaigns for stores like Armorpoxy, ensuring PPC, email marketing, and product feed optimization. This led to 3X leads during the black Friday shopping event.
Achieved 20X Leads for Armor Garage
Using paid ads and improved product listings, Armor Garage saw a 20X jump in leads for Black Friday. By combining precise targeting, compelling creative, and timed campaigns at peak shopping times, he turned a limited opportunity into a substantial revenue stream.
To give you a clearer perspective on the advantages of outsourcing your Black Friday marketing to us, we’ve put together this short video:
Conclusion
Black Friday is not just about selling things quickly; it’s a chance to grow your brand, drive new customers, and strengthen your market presence. Winning means having a clear plan, using all marketing channels together, and letting data guide every campaign.
At Hustle Marketers, Ishant Sharma has helped many business owners unlock the potential of Black Friday Marketing. From optimizing product feeds and targeting PPC campaigns to creating urgency-driven promotions and retargeting abandoned carts, his marketing strategies are designed to deliver results.
By choosing Ishant Sharma as your marketing expert for Black Friday, you gain expertise, precision, and a focus on maximizing ROI. Don’t leave your results to luck; turn to Ishant Sharma to make your Black Friday marketing campaign a success. Contact us today and get ready to set new sales records and power term growth this Black Friday.
Frequently Asked Questions
When should I start Black Friday marketing campaigns?
Are email campaigns more effective than social media for Black Friday?
How can I create urgency without discount wars?
What is the role of product feeds and Promotion IDs?