Ultimate Guide to Top 25 KPIs For E-commerce

Ishant
Published : February 19, 2023 at 5:56 pm
Ishant
Struggling to measure success? This comprehensive list of the top 25 KPIs for eCommerce shows you exactly what to track and why.
Running an online store is no walk in the park. You will have products to manage, marketing campaigns to optimize, customers to keep happy, and profit margins to grow. However, how will you improve your ROI if you don’t measure where you stand now?
You might already be tracking some numbers, like website traffic, sales, and maybe even your social media engagement. But are you tracking the right numbers? With so many metrics out there, it’s easy to feel like you are drowning in data, while still not knowing what’s actually driving your business forward.
That’s where Key Performance Indicators (KPIs) come in. They give you a clear picture of what’s working, what’s not, and where you should focus your efforts. The problem is, that there are tons of key performance indicators for eCommerce, but not all of them are worth your time.
So, how do you cut through the noise, and focus on what really matters? Well, I have got you covered! In this ultimate guide, I will break down the top 25 KPIs for eCommerce, explain why they matter, and show you how to use them to scale your business smarter, not harder.
Ready to turn your data into dollars? Let’s dive in!
What Are KPIs for E-Commerce?
KPIs for eCommerce, or Key Performance Indicators are like your business’s health check-ups. They are the key ecommerce growth metrics that tell you whether your online store is thriving, just surviving, or quietly waving a white flag behind the scenes.
The numbers tracked through important KPIs for eCommerce help you measure progress towards your goals, spot issues before they snowball, and make smarter decisions about where you spend your time (and money).
Are all eCommerce Metrics are KPIs?
No, they are not. Just because you can track something doesn’t mean you should. KPIs are the MOST IMPORTANT numbers that align directly with your business objectives. Whether it’s boosting sales, improving customer loyalty, or trimming down those pesky cart abandonment rates, eCommerce KPIs help you to stop guessing and start growing. You get real insights into what’s driving your success, and what’s holding you back.
Think of it this way: If metrics are stars in the sky, KPIs are your North Star- the one, which you use to navigate.
In case you are wondering what are KPIs for eCommerce, stick with me, and I will show you exactly which KPIs deserve a spot on your radar.
#1 Bounce Rate
For your online store, bounce rate refers to the percentage of visitors who arrive at a digital storefront and “bounce” or leave before ever going to a second page.
Why it Matters?
A high bounce rate means that visitors are peeking at your site… and running away before taking action. Not good right? A high bounce rate hints at poor page relevance, slow load times, or a bad user experience.
When to track?
You need to monitor bounce rates weekly or after launching major campaigns or site updates.
How to Calculate?
Although some eCommerce analytics show the bounce rates directly, here’s the formula to calculate the bounce rate.
Bounce Rate = [Single page sessions / Total Sessions] x 100
Pro Tip: Try to keep the bounce rate low (ideally less than 40%) by optimizing your landing pages and making sure all your pages are lightning-fast and super relevant.
#2 Customer Retention Rate
This is the percentage of existing customers who continue making purchases from your online store for a specific span.
Why it Matters?
Retaining customers is cheaper than acquiring new ones. This is why you need a strong customer retention rate because more loyal fans mean more steady revenue.
When to track?
You can track customer retention KPIs monthly or quarterly, especially after new loyalty or engagement strategies are deployed in your campaigns.
How to calculate?
Customer Retention Rate= [(Customer at end of the period – New customers acquired) / Customers at start of period] x100
#3 Social Media Engagement
Social media engagement refers to the interactions and conversations between your brand and customers on social media, and it measures how people are connecting with the content and approach on your social media handle.
Why it matters?
Engagement shows how connected your audience feels with your brand, and more likes, comments, and shares mean more organic reach and customer love.
When to track?
You can track it weekly or after major social campaigns.
How to Calculate?
Engagement Rate= (Total engagements like comments, shares/ Total followers or reach) x100
#4 Inventory Levels
In eCommerce, the “inventory levels” define the quantity of goods available for sale in a company across its distribution network, including warehouses, logistics centers, and retail locations at any given time.
Why it Matters?
Good inventory management means fewer sales lost along the way and less money stuck in unsold stock. This is why you need to stay agile and avoid stockouts and overstocking.
When to track?
You can track inventory levels daily for fast-moving products, and weekly for slow-moving goods.
How to calculate?
This is quite simple, as all you need to do is regularly check inventory via warehouse management systems or manually count against the forecast.
#5 Subscriber Growth Rate (SGR)
The SGR is a metric that measures the success of your brand’s subscription service. It tracks the rate at which new customers join your company’s subscription service over a defined period of time.
Why it Matters?
This one is among the top 10 KPIs for eCommerce because your email list is gold. A growing subscriber base on your email listings or your product range means more opportunities for direct marketing and nurturing loyal customers.
When to track:
Weekly or monthly, depending on campaign volume.
How to Calculate?
Subscriber Growth Rate = {(New Subscribers-Unsubscribers)/ Total subscribers at start of the campaign) x100
#6 Average Order Size
This is in the list of the most important KPIs for eCommerce because it is the average amount spent each time a customer places an order.
Why it matters?
Improving the Average Order size even slightly can dramatically increase the revenue without needing more customers. In fact, upselling and cross-selling tactics can work wonders here.
When to track?
You can track the average order size among all your eCommerce KPI benchmarks monthly or after introducing upsell offers or bundle deals.
How to calculate?
Average Order Size= Total Revenue/ Number of Orders
#7 Average Margin
Average margin is the difference between what it costs you to produce/buy a product and the price you sell it for, and this is expressed as a percentage.
Why it matters?
High margins = more profit = more money to reinvest and scale.
When you have a low margin, it means you are working harder for less, which makes it one of the most important eCommerce KPIs for sales.
When to track?
Track your average margin every month, and every time supplier costs or pricing strategies change.
How to calculate?
Average Margin in %= {(Sales Revenue- Cost of Goods Sold)/ Sales Revenue} x100
#8 New Visitors v/s Returning Visitors
This one is self-explanatory as it is the ratio of first-time visitors to those who have visited your site visitors.
Why it matters?
This ratio tells you if you are attracting new eyes and keeping your audience engaged. It should be precisely balanced, and it is the key to growth and brand loyalty.
How to calculate?
Most analytics platforms like Google Analytics show this automatically, but conceptually speaking:
New v/s Returning Visitors= New Visitors % : Returning Visitors %
#9 Contact Costs (CPC and CPO)
CPC or the Cost Per Click is how much you pay for each ad click, and CPO or Cost Per Order is how much it costs you to acquire one paying customer.
Why it matters?
High CPC or CPO means your ad campaigns are unprofitable. This is why you need to keep these metrics in check to ensure that your marketing money is well spent.
When to track?
You must track the CPC and CPO after every paid ad campaign or ongoing campaign if you are running ads continuously.
How to Calculate?
CPC= Totaal Ad spend/ Total Clicks
CPO= Total ad spend/ Total orders
Pro Tip: While you are tracking the CPC and CPO, don’t forget the Cost per Lead (CPL). Cost Per Lead (CPL) helps you understand how much you are spending to acquire each potential customer. Monitoring CPL ensures your marketing budget is being used efficiently, allowing you to optimize campaigns, maximize ROI, and scale your business without overspending.
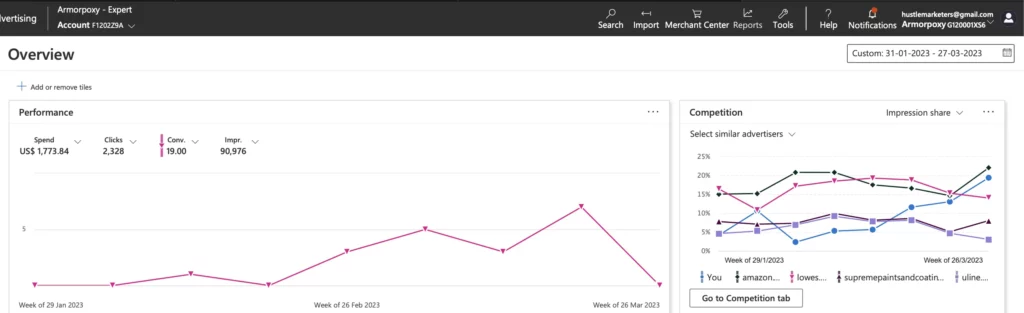
When it comes to high-ticket e-commerce products, it’s not just about getting direct orders. A lot of times, people want to enquire first before making a purchase decision. That’s why instead of pushing for an immediate sale, it’s smarter to create a lead form.
We had the same experience with one of our high-ticket e-commerce clients, Armoproxy– most users preferred to reach out with questions before buying. So, in these cases, focus on CPL (Cost Per Lead) and CPA (Cost Per Acquisition) as your main metrics. Also, we integrated lead forms with a CRM like HubSpot to track conversions properly.
Here’s how the conversion started climbing-
#10 Email Open Rate
The email open rate is the percentage of people who open your marketing emails out of the total number of people who receive them.
Why it matters?
This eCommerce performance tracking metric is important because high open rates mean your subject lines are engaging and your audience is active. Low rates mean it’s time to tweak your approach.
When to track?
After each email campaign.
How to calculate?
Email open rate percentage = (Emails Opened/ Emails Delivered) x100
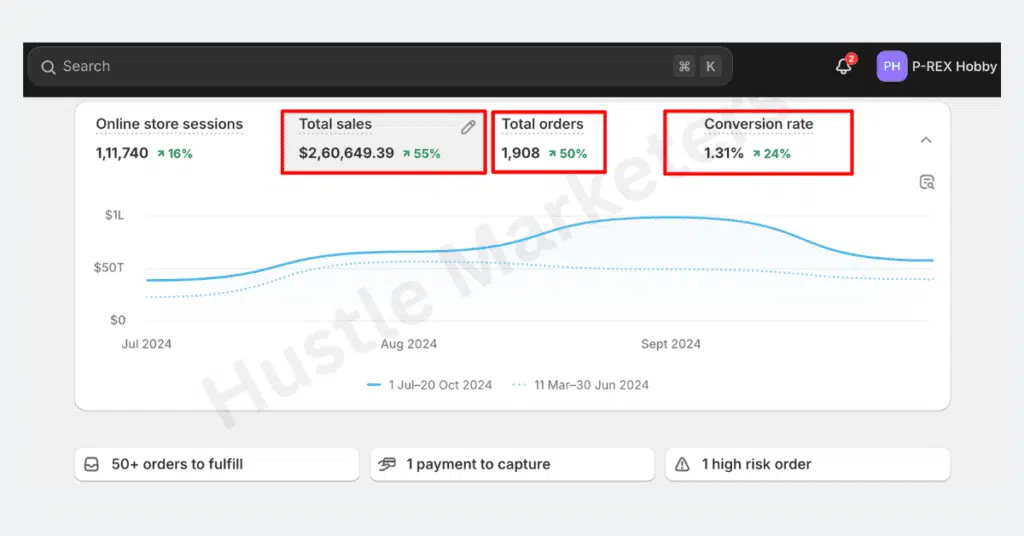
#11 Blended ROAS
The blended ROAS is the Return on Ad Spend across all your marketing channels combined.
Also Read: 7 Key Metrics to Improve Your ROAS in 2025
Why it matters?
Among all the ecommerce marketing KPIs are important because it gives a full picture of how well your ad investments are paying off, beyond isolated campaigns.
When to track?
Monthly, so you can get a realistic look at the overall marketing performance.
How to calculate?
Blended ROAS= Total revenue from ads/ Total ad spend
Here’s how we improved ROAS for P-REX Hobby with better audience targeting in our PPC campaigns.
#12 Page Views Per Visit
The page views per visit signifies the average number of pages a user looks at during one visit to your site.
Why it matters?
Higher views often mean better engagement and higher chances of conversion.
When to track?
Weekly or monthly to detect shifts in engagement.
How to Calculate?
Page views per visit= Total page views/ Total visits
#13 Time on Site
The time on site is the average time visitors spend browsing your website during one session.
Why it matters?
Longer times usually indicate stronger interest and better user experience, unless they are stuck confused.
When to track?
Monthly or after major site changes, especially like a big design or content updates.
How to calculate?
Time on site= Total duration of all sessions/ Number of sessions
#14 Chrun Rate
The churn rate is the percentage of customers who stop buying from you over a specific period of time.
Why it matters?
This eCommerce business metric is important because it’s cheaper to keep a customer than to find a new one, and high churn signals customer dissatisfaction or better offers elsewhere.
When to track?
Monthly or quarterly.
How to calculate?
Churn rate percentage= (Customers lost during the campaign period / Total customers at the start of the period) x100
#15 Customer Satisfaction (CSAT) Score
Customer satisfaction measures how satisfied customers are with your product or service, and it’s usually analyzed via a simple survey.
Why it matters?
Happy customers can be repeat customers and brand advocates, and unhappy ones can be your brand’s silent sales killers, this is why the CSAT scores matter.
When to track?
Among all the online store KPIs, you can track this after purchases, support interactions, or major customer touchpoints.
How to calculate?
CSAT %= (Number of Satisfied Customers/ Total Survey Responses) x100
Customers usually rate you between 1 to 5, and you can count ratings of 4 and 5 as “satisfied.”
#16 Refund and Return Date
The refund and return date is the percentage of sold products that customers send back.
Why it matters?
This one is one of the most crucial KPIs in the list of eCommerce success metrics because high return rates can destroy profit margins and hint at product quality or expectation issues.
When to track:
Monthly or after any major product launches.
How to calculate?
Refund/ Return Rate (%)= (Number of Returned Orders/ Total Orders Shipped) x100
#17 Cart-to-Detail Rate
The cart-to-detail rate is the percentage of users who add a product to their cart after viewing its detail page.
Why it matters?
It shows how convincing your product pages are. If you have low rates, it’s time to rethink your photos, descriptions, or pricing.
How to calculate?
Cart-to-detail Rate (%)= (Products added to the cart/ Product detail page views) x100
#18 Buy-to-Detail Rate
This one is the percentage of users who buy a product after viewing its detail page.
Why it matters?
The buy-to-detail rate is the ultimate proof that your product page is doing its job. If it’s low, even a good cart rate won’t save you.
When to track?
You can track it monthly or after changes to product pricing, design, or marketing strategies.
How to calculate?
Buy-to-Detail Rate (%)= (Purcahses/Product detail page views) x100
#19 Mobile Site Traffic
As its name says, this is the number or percentage of site visitors coming from mobile devices.
Why it matters?
Mobile site traffic is necessary for eCommerce revenue tracking because mobile shopping is booming, and if your mobile experience sucks, you are leaving money on the table.
When to track?
Weekly or monthly, especially after mobile site updates.
How to calculate?
The mobile site traffic is usually pulled from analytics tools and it is calculated as follows:
Mobile Site Traffic (%)= (Mobile Visitors/ Total Visitors) x100
#20 Gross Merchandise Volume (GMV)
The GMV is defined as the total value of merchandise sold through your platform over a certain period.
Why it matters?
It’s a high-level indicator of sales activity, which is especially useful for marketplaces and multi-vendor platforms.
When to track?
Monthly or quarterly.
How to calculate?
GMV=Total Sales Amount Before Deductions (like returns, discounts, fees)
#21 Desktop Site Traffic
The desktop site traffic is the number or percentage of site visitors coming from desktop devices.
Why it matters?
While mobile dominates many sectors for some businesses, especially the B2B or higher-ticket items, desktop users still make up the majority of purchases.
When to track?
You can track it monthly, or alongside mobile traffic to see how user behavior differs.
How to calculate?
Desktop site traffic (%)= (Desktop visitors/Total visitors) x100
#22 Customer Effort Score (CES)
The CES is a metric that measures how easy (or difficult) it is for customers to complete a task with your brand, like buying a product or resolving an issue.
Why it matters?
The easier you make it for your customers, the more loyal they become, and the higher the effort is, the more you can expect frustration and drop-offs.
When to track?
After critical interactions, like checkout or customer support calls.
How to calculate?
The CES can be typically asked via a survey (like how easy was it to do X?) on a scale of 1 to 5. Then:
CES= Total CES Score/ Number of responses
#23 Net Promoter Score (NPS)
The NPS measures how likely customers are to recommend your brand to others, on a scale from 0 to 10.
Why it matters?
The NPS acts as a crystal ball for your brand loyalty and customer satisfaction. You can track the NPS and the higher your NPS would be, the stronger will be the word-of-mouth marketing for your brand.
When to track?
Quarterly or after major campaigns or product launches.
How to calculate?
Ask customers: “How likely are you to recommend us?” Classify responses on the following bases:
- 9-10: Promoters
- 7-8: Passives
- 0-6: Detractors
#24 Average Order Value (AOV)
AOV is basically the average amount of money a customer spends each time they place an order on your site.
Why it matters?
A higher AOV means you are making more money from every single transaction without needing more customers. I would say it’s a big deal because scaling revenue is way easier if you can get people to add one more thing to their cart instead of fighting for new traffic every time.
When to track?
You can track OV monthly or after launching promotions, upselling campaigns, or bundle deals. If you run an online store, this is one of those KPIs for eCommerce that you always need to watch.
How to Calculate?
Calculating AOV is super simple math:
AOV= Total Revenue/ Number of orders.
For example, if made $50,000 from 1,000 orders in a month, your AOV is $50.
#25 Conversion Rate
Ecommerce Conversion Rate tells you the percentage of visitors who actually take a desired action- making a purchase, as compared to the total number of visitors.
Why it matters?
You can drive a million people to your site, but if your conversion rate stinks, you’re not making money. A high conversion rate means your site, product pages, and checkout flow are doing their jobs and turning browsers into buyers.
When to track:
Daily, weekly, and monthly. Especially important after website updates, ad campaigns, or major marketing pushes.
How to calculate:
Here’s the formula:
Conversion Rate (%)=[Number of Conversions (Purchases)/ Total Website Visitors] x 100
For example, if 5,000 people visit your store and 150 people buy something, your conversion rate is 3%.
What You Need to Know About Ecommerce Order Fulfillment KPIs?
When it comes to running a smooth ecommerce operation, order fulfillment is everything. If you are not keeping a close eye on your KPIs (key performance indicators), you could be leaving a lot of money, and customer loyalty on the table. Let’s walk through the ones you absolutely can’t ignore:
- On-time Shipping:
Think about the last time you ordered something and it didn’t show up when it was supposed to. Frustrating, right? Your customers feel the same. On-time shipping is all about making sure orders leave your warehouse when you promised. Nail this, and you’ll keep customers happy (and coming back for more). - Order Cycle Time
This one tracks how long it takes from the moment someone clicks “Buy Now” to when their order gets shipped. The shorter this time, the better. People are used to lightning-fast deliveries these days, so keeping your cycle time low is a major win for customer satisfaction. - Order Picking Accuracy
Imagine ordering a blue sweater and getting a red pair of socks instead- not ideal right? Picking accuracy is about getting the right product into the right box every time. It saves you from returns, refunds, and those awkward “uh-oh” emails from upset customers. - Perfect Order Rate
If an order is picked accurately, packed properly, shipped on time, and arrives undamaged- that’s a perfect order. The more perfect orders you rack up, the better your reputation (and your profit margins) will be. This KPI tells you how close you are to being, well, perfect. - Orders Picked Per Hour
Speed matters. Orders picked per hour measure how quickly your team can process orders. If it’s too slow, you might need to look at better training, clearer processes, or even a little tech upgrade to keep things moving.
Wrapping It Up: Are You Tracking the Right KPIs for Ecommerce Yet?
At the end of the day, ecommerce success isn’t just about flashy websites or big marketing budgets; it’s about delivering on your promises. If you are not keeping a close watch on these KPIs yet, don’t stress because today’s a great day to start. Start small, pick one or two metrics that matter most to your current goals, and build from there. Trust me, the impact will show up faster than you think. Need more information, or want expert advice on eCommerce KPIs? Reach out to our team at Hustle Marketers today for a complete eCommerce site audit or comprehensive eCommerce SEO services!
Frequently Asked Questions
What are the KPIs for eCommerce?
Which key performance indicators for eCommerce are most crucial?
What do KPIs and Metrics mean?