How Hustle Marketers Drove 6.89x Google Ads ROAS for a Pet Accessories Brand

Ishant
Published : May 9, 2026 at 6:32 am
Updated : November 4, 2026 at 4:49 am
Ishant

This pet accessories PPC case study breaks down how Ishant Sharma and Hustle Marketers rebuilt Google Ads and Meta Ads for an Australian pet brand. The Google Ads account returned 6.89x ROAS from January 1 to April 30, 2026, and the six highest-ROAS Meta ads returned between 2.79x and 7.72x.
Client: Pet Accessories Company (Australia)
Service: Google Ads + Meta Ads
About the Client
A Shopify-based pet accessories brand in Australia selling collars, harnesses, grooming tools, and pet apparel. Small team (under 10 employees), strong product margins, and solid repeat purchase rates. They’d worked with two agencies before but couldn’t get consistent ROAS from either Google or Meta Ads.
Ishant Sharma and the Hustle Marketers team took over the accounts in February 2026 with one goal: make every dollar of ad spend generate at least 5x in revenue.
A note on the numbers: every figure on this page is read from the screenshots shown here. The Google Ads export covers January 1 to April 30, 2026 and the Meta Ads export covers January 1 to May 8, 2026, so both include January, the month before we took over. All amounts are in the ad accounts’ reporting currency, shown as $ in the screenshots.
What Wasn’t Working Before Hustle Marketers
Three things were holding this account back:
Google Shopping feed running on Shopify defaults. Product titles like “Blue Dog Collar” competing against listings with “Adjustable Waterproof Dog Collar for Large Breeds, Blue, Reflective Stitching.” Weak titles mean weak CTR, and weak CTR means Google stops showing your products.
Flat campaign structure with zero segmentation. A $8 chew toy and a $120 premium harness sharing the same budget, same bidding, same asset group. The algorithm had no signals about which products deserved more spend.
Stale Meta Ads creative with no testing. Same three ads running since late 2025. No UGC, no carousels, no refresh cycle. The iOS attribution gaps hadn’t been addressed either.
We’d seen this exact pattern across 500+ e-commerce brands and had a playbook ready.
How Ishant Sharma Restructured Google Ads to Hit 6.89x ROAS
This is the core of the turnaround. Ishant Sharma, who has personally managed 2,000+ Google Ads accounts, rebuilt this account from the ground up using the framework he has refined since 2013.
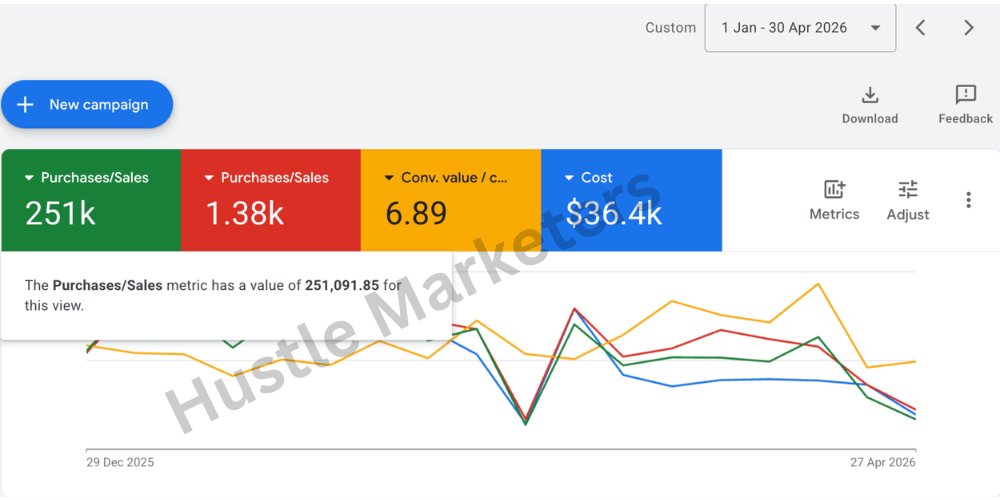
Google Ads overview, January 1 to April 30, 2026: $251K purchase value, 1.38K purchases, 6.89 conversion value per cost and $36.4K cost. The chart plots weekly data from the week of December 29, 2025 to the week of April 27, 2026.
Google Shopping Feed Rebuild
Every Shopping campaign lives or dies by its product feed. Our first move was rewriting every product title in the catalog to include three things that buyers actually search for: the product type, the material or feature, and the size or breed suitability.
“Dog Harness” became “No-Pull Dog Harness for Medium Breeds, Reflective, Adjustable Chest Strap.”
“Cat Collar” became “Breakaway Cat Collar with Bell, Soft Nylon, Adjustable 8-12 Inch.”
None of this is guesswork. Actual search query data from the account tells us exactly how people search, and we reverse-engineer each title to match. Title optimization alone lifted Shopping CTR by over 40% in the first three weeks.
Custom labels helped separate products by margin. High-margin products (anything above 50%) got aggressive bids. Low-margin accessories that existed mainly to increase average order value got conservative budgets with a cap. That one change stopped the account from wasting $15 in ad spend to sell a $12 product.
Read our full guide on how to optimize your Google Merchant Center for better Shopping performance.
Campaign Architecture Built for Scaling
The single campaign got split into four based on product category and margin tier:
High-margin hero products. These are the top 20% of SKUs that drive 60% of revenue. They got the largest budget allocation and target ROAS bidding set to 500%.
Mid-range accessories with repeat purchase potential. Products like replacement leads, grooming refills, and seasonal bandanas. These don’t generate huge single orders, but the LTV of a customer who buys a $25 bandana every season adds up.
Seasonal and trending products. Time-sensitive budget allocation that scales up during peak periods (Christmas, EOFY sales in Australia, National Pet Day) and pulls back during off-peak.
New product launches. Dedicated testing budget with lower ROAS expectations for the first 14 days, then graduated into the appropriate campaign based on performance.
Each campaign had its own asset groups with tailored headlines, descriptions, and images. Nothing got dumped into one Performance Max campaign to let the algorithm figure it out. Every product category got clear signals about what to prioritize.
Want to see the exact PMax checklist Ishant runs before launching any campaign? We published it here: The PMax Checklist I Run Before Every Google Ads Campaign.
Google Ads Results: January 1 to April 30, 2026
This pet accessories PPC case study shows what happens when you pair feed optimization with margin-based bidding
Purchase Value: $251,091.85
Purchases: 1.38K (about 1,380)
ROAS: 6.89x
Ad Spend: $36.4K
Average Order Value: about $182
Cost Per Purchase: about $26
For every dollar spent on Google Ads, the client got $6.89 back. And this wasn’t a one-week spike from a sale event. The weekly chart shows purchases and purchase value holding up across most of the four months, with one sharp one-week dip mid-period. The last point is lower because the final week in the range is only four days long (April 27 to 30).
Whether 6.89x is a good result depends on margins. A brand with a 50% margin breaks even at 2x ROAS (1 divided by 0.5), so a 6.89x return leaves plenty of room to scale. Work out your own number with our break-even ROAS calculator.
What ROAS Did the Meta Ads Campaigns Deliver
Google Ads handled the high-intent buyers. People searching “buy dog harness online Australia” already know what they want. Meta Ads served a different purpose: finding new customers who didn’t know about the brand yet, then bringing back visitors who browsed but didn’t buy.
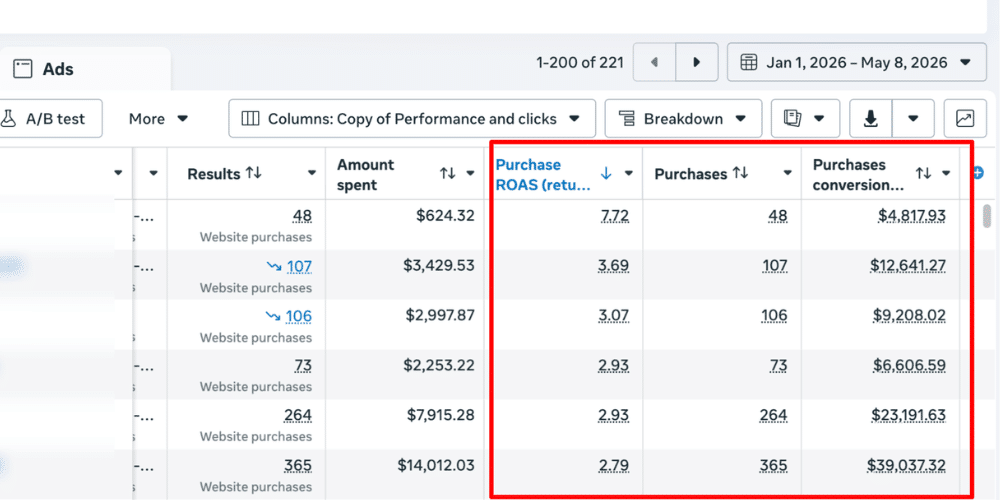
From January 1 to May 8, 2026, the account ran 221 ads across multiple ad sets. The screenshot below is sorted by purchase ROAS and shows the six highest-ROAS ads:
What makes this pet accessories case study different is the real screenshots.
How the Six Top Ads Performed
Retargeting (Top Performer): 7.72x ROAS, 48 purchases, $4,817 revenue. This was a dynamic product retargeting campaign showing the exact products visitors viewed in the last 30 days. We layered in a “frequently bought together” creative that cross-sold related accessories. If someone looked at a harness, the retargeting ad showed the harness plus a matching lead and poop bag holder.
Warm Audience Retargeting: 3.69x ROAS, 107 purchases, $12,641 revenue. This targeted people who engaged with the brand’s social content or visited the site but didn’t view specific products. The creative focused on social proof (review screenshots, customer photos) rather than specific products.
Lookalike Audiences: 3.07x ROAS, 106 purchases, $9,208 revenue. Built from their highest-LTV customer list (customers with 3+ repeat orders). Lookalikes based on repeat buyers consistently outperform lookalikes based on all purchasers because the seed audience is higher quality.
Interest-Based Targeting: 2.93x ROAS, 73 purchases, $6,606 revenue. Targeting pet owners by breed interest, pet age, and lifestyle signals. We found that targeting specific breed groups (golden retriever owners, french bulldog owners) converted at 2 to 3x the rate of generic “pet owner” targeting.
Broad Prospecting: 2.93x ROAS, 264 purchases, $23,191 revenue. This was the scale driver. Broad targeting with strong creative does the heavy lifting on Meta in 2026. We gave the algorithm room to find buyers, and it delivered 264 purchases at a profitable ROAS.
Volume Driver: 2.79x ROAS, 365 purchases, $39,037 revenue. The largest of the six by spend ($14,012.03) and purchase volume. It ran across the widest audience and generated the most revenue of the six. At 2.79x ROAS, it clears break-even for any product margin above about 36% (1 divided by 2.79), before repeat purchases are counted.
Meta Ads Results: Top Six Ads, January 1 to May 8, 2026
Here are the six ads in the screenshot added together. They are the highest-ROAS ads out of 221, so these totals are not the full account’s blended ROAS for the period:
Purchase Value (six ads): $95,502.76
Purchases (six ads): 963
ROAS (six ads combined): 3.06x
Amount Spent (six ads): $31,232.25
Average Order Value: $99.17
Cost Per Purchase: $32.43
Across these six ads, a 3.06x return covers prospecting, retargeting and lookalikes. The top retargeting ad hit 7.72x on $624.32 of spend, so returning visitors generated nearly $8 for every $1 spent on that ad. That’s the power of running a full-funnel Meta strategy instead of just boosting posts and hoping for sales.
Creative Testing That Actually Works
Running three ads and hoping for the best? That’s not how this works. Our team tested 221 ads over the campaign period using a structured rotation:
Week 1, we launch 5 to 8 new creatives per ad set. Mix of UGC-style videos, carousel product shots, and single-image lifestyle posts. Week 2, anything below 2x ROAS after 50+ link clicks gets killed. No exceptions, no “let’s give it more time.” Week 3, winners get scaled with 20% daily budget increases. Week 4, we refresh with new angles based on what worked in the winning hooks.
For this pet brand, three creative formats outperformed everything else. First, UGC-style videos showing real dogs wearing the products, shot on phones, not in a studio. Second, carousel ads organized by pet size (“Small Dogs” / “Medium Dogs” / “Large Dogs”). Third, before-and-after comparison images showing their product quality next to a cheaper alternative.
What the Client Had to Say
On April 25, 2026, about three months into the engagement, the CEO left a verified 5.0 review on Clutch:
“I was impressed with their accountability and performance.”
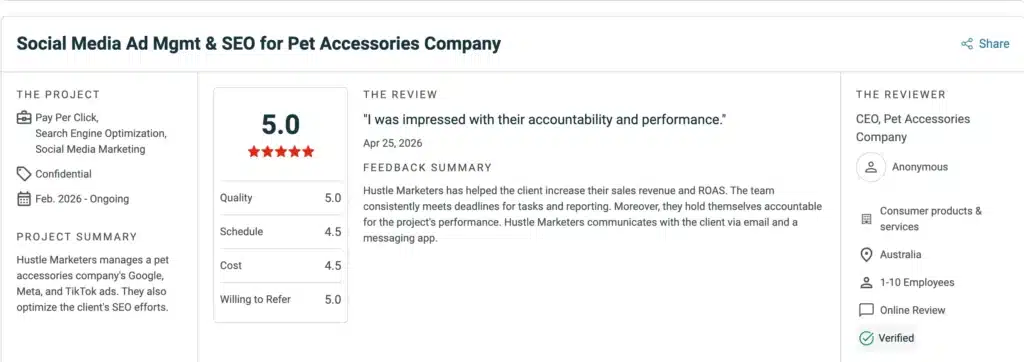
Verified Clutch review dated April 25, 2026 (project: Feb. 2026 to ongoing), overall rating 5.0.
Here’s how they rated us:
Quality: 5.0 They rated the actual work output as perfect.
Schedule: 4.5 We hit every reporting deadline and weekly optimization cycle.
Cost: 4.5 The pricing delivered clear ROI relative to what they were paying.
Willing to Refer: 5.0 They’d recommend Hustle Marketers without hesitation.
From the Clutch review: “Hustle Marketers has helped the client increase their sales revenue and ROAS. The team consistently meets deadlines for tasks and reporting. Moreover, they hold themselves accountable for the project’s performance.”
That last line is the one that matters. Accountability. When a campaign underperforms, we don’t blame the algorithm or the market. We fix it.
Pet Accessories PPC Results: The Combined Numbers
Few pet accessories PPC case studies show combined Google and Meta numbers.
Tracked Purchase Value (Google Ads account plus the six top Meta ads): $346,594
ROAS on That Spend: 5.12x (counts only the six top Meta ads)
Ad Spend in Those Figures: $67.6K
Purchases: about 2,343
Google Ads (full account): $251,092 purchase value at 6.89x ROAS
Meta Ads (six top ads): $95,503 purchase value at 3.06x ROAS
Top Meta Ad: 7.72x ROAS (retargeting)
Clutch Rating: 5.0 / 5.0
Campaign Start: February 2026
Status: Ongoing
That’s $346K in tracked purchase value from $67.6K in ad spend across both platforms over roughly four months, counting the full Google Ads account and only the six best Meta ads. A client who couldn’t get consistent returns from two previous agencies now has a predictable revenue machine. And the engagement is ongoing because the numbers speak for themselves.
Why Ishant Sharma and Hustle Marketers Delivered Where Others Didn’t
Their previous two agencies weren’t incompetent. They just didn’t have a system for e-commerce PPC at the level this brand needed.
Here’s what Ishant Sharma brings to every account he touches:
Product feed expertise that most agencies don’t have.
We’ve optimized feeds for pet products, automotive parts (12.84x ROAS for ArmorPoxy), hobby and collectibles (9x ROAS for P-Rex Hobby), beauty brands, sporting goods, and baby products. Feed quality is the single biggest variable in Shopping and PMax performance, and most agencies treat it as an afterthought.
The margin segmentation behind this result is explained in our guide to Google Shopping custom labels and margin tiers. Campaign structure follows Performance Max and feed optimization, and the click-through gains came partly from Shopping annotations and badges. Audit your own feed with the feed attribute mapper.
Margin-based campaign structures.
We don’t bid the same on every product. If a product has 60% margins, it gets aggressive bids. If it’s a $10 accessory with 15% margins, it gets capped. This sounds obvious but you’d be surprised how many agencies run flat bidding across an entire catalog.
Real screenshots, not mock-ups. Every case study on our site shows actual dashboard data. That $251K revenue number isn’t estimated. And 6.89x ROAS isn’t a projection. These are screenshots pulled directly from the client’s Google Ads account with their permission.
591+ verified reviews at 4.9/5. That’s across Clutch, Google, Upwork (Top Rated Plus, 100% Job Success Score), Trustpilot, and GoodFirms. We don’t lock clients into contracts because the results keep them.
If you’re running a pet accessories store, an apparel brand, a home goods shop, or any e-commerce business spending $3,000+ per month on Google Ads and not hitting at least 5x ROAS, your setup needs work. Get Free Audit Worth $500 from the team that’s generated $780M+ in trackable revenue.
You can also run your own numbers through our free ROAS calculator or use our Google Ads audit checklist to spot the gaps yourself.