How Much Should You Spend on Google Ads? The 2026 Cost Guide

Ishant
Published : September 28, 2026 at 12:06 pm
Updated : October 7, 2026 at 8:08 am
Ishant

The average cost per click in Google Ads is $5.42. It is also $2.69. And $2.00. And, according to one page’s own meta description, eleven cents.
Those are all live figures, published in 2026, on pages currently ranking for this question. We pulled every benchmark we could find and the spread on the single most important number in this topic is 5.4x, or 49x if you count the outlier. Nobody reconciles them. Every page publishes its number as though the others do not exist.
So this guide does two things no other cost page does. It reconciles the published benchmarks with their dates and sample sizes so you can see which one applies to you. And it gives you the total cost, ad spend plus management fee plus tooling, because your real cost is not your ad budget.
Straight answer first, then the working.
How much does Google Ads cost in 2026?
For a US small business, expect $1,000 to $10,000 a month in ad spend, with most accounts landing between $1,000 and $2,500 when they start. WordStream’s study of over 15,000 accounts puts average account spend at $3,127.38 a month, and distributes accounts as 24% under $1,000, 39% between $1,000 and $10,000, and 37% above $10,000.
Cost per click depends almost entirely on your industry. Legal, insurance and finance are the expensive end. Arts, travel and restaurants are the cheap end. The gap between them is more than tenfold.
But the honest answer to “how much does Google Ads cost” is that it is the wrong question. The right one is “what is the smallest budget that can produce enough conversions for this to work”, and that has a real answer we work through below.
Why does every website give a different cost per click?
Because they are quoting different datasets from different years, and most of them do not say which.
Here is every published average Search CPC we could find on pages ranking for this topic, with its date. This table does not exist anywhere else, and building it is the single most useful thing on this page.
Published average Search CPC, reconciled
| Source | Date stated | Average Search CPC | Sample size stated? |
|---|---|---|---|
| WordStream, cost page | 19 Aug 2026 | $5.42 | Yes, “over 15,000 Google Ads accounts” |
| WordStream, 2025 benchmarks | Updated 18 May 2026 | $5.26 | Yes, 16,446 US search campaigns, Apr 2024 to Mar 2025 |
| Shopify, citing WordStream | 19 Aug 2025 | $5.26 | Inherited |
| WebFX, benchmarks page | 24 Jun 2026 | $2 to $4 | No |
| WebFX, cost page | 16 Jul 2026 | $1 to $5 | No |
| Store Growers | Updated 8 Jan 2026 | $2.69 | No |
| Business of Apps | 4 Jun 2026 | $2.69 | No |
| NinjaPromo | Updated 6 Dec 2025 | $2.69 | No |
| Brafton, body copy | 12 Jun 2026 | $1 to $3 | No |
| Brafton, meta description | 12 Jun 2026 | $0.11 to $0.50 | No |
| LYFE Marketing | Updated 29 Jul 2026 | $1 to $2 | No |
The $2.69 cluster is a fossil. That figure, paired with a $0.63 Display CPC, is WordStream’s 2018 to 2019 benchmark set. Business of Apps publishes a historical table on its own page showing 2019 at $2.69 and “2024 projected” at the identical $2.69, which is an admission in plain sight. Store Growers republishes the complete 2018-19 set, $2.69 CPC, $0.63 Display, 3.17% CTR, 2.81% conversion rate, $45.27 CPA, under a January 2026 update stamp.
So when you see $2.69 quoted as a 2026 average, you are reading seven-year-old data with a fresh date on it.
Which number should you use? WordStream’s, and specifically the benchmarks page rather than the cost page, because it is the only source in this entire category that publishes a real methodology. Verbatim: “This report is based on a sample of 16,446 US-based search advertising campaigns running between April 1, 2024, and March 31, 2025. Each category includes at minimum 64 unique active campaigns. ‘Averages’ are technically median figures to account for outliers. All currency values are posted in USD.”
Sample size, date range, a per-category floor, and a disclosure that the averages are medians. Nobody else comes close, and it is worth saying so plainly even though WordStream is a competitor on this query.
Which cost benchmarks should you actually trust?
Four of roughly fifty pages we reviewed state any methodology at all. Here is how they hold up.
Benchmark sources, graded
| Source | Methodology stated | Verdict |
|---|---|---|
| WordStream 2025 benchmarks | 16,446 US campaigns, Apr 2024 to Mar 2025, minimum 64 campaigns per category, medians not means | Use this one. The only fully disclosed methodology in the category |
| WordStream cost page | “Our study of over 15,000 Google Ads accounts” | Usable. Sample size but no date range. Note it reports CPL as $66.69 while the benchmarks page says $70.11 |
| WebFX PPC benchmarks | Proprietary client data “last updated in October 2025”, Ahrefs API data from December 2025, plus practitioner insights from forums | Honest disclosure, but the proprietary leg is roughly 11 months stale and one leg is anecdote |
| WebFX Google Ads benchmarks | “Proprietary, aggregated WebFX campaign data”. No sample size, no date range | Directional only |
| Focus Digital | Claims a research team analysed 23 sectors and $1.2 billion in Google Ads spend, Mar 2025 to Jul 2026 | Treat with caution. Its industry CPC figures are identical to WordStream’s to the cent: Attorneys $9.87, Home Improvement $8.33, Dentists $8.00. An independent $1.2B study would not reproduce another firm’s medians exactly |
| Store Growers, Business of Apps, NinjaPromo, Brafton, LYFE | None | Republished, undated or fossilised data |
That Focus Digital row is worth pausing on, because it is the pattern to watch for generally. A large, impressive-sounding proprietary sample whose headline numbers happen to match the best-known public dataset exactly is not independent corroboration. It is the same number wearing a different coat, and it makes the disagreement in the market look smaller than it is.
What does a click actually cost in my industry?
This is where the disagreement gets extreme, and where you most need to know whose number you are reading.
Legal and attorney CPC, the widest spread in the category
| Source | Date | Figure |
|---|---|---|
| Store Growers, highest of any vertical | 8 Jan 2026 | $6.75 |
| WordStream 2025 benchmarks | 18 May 2026 | $8.58 |
| NinjaPromo | 6 Dec 2025 | $8.94 |
| WordStream cost page | 19 Aug 2026 | $9.87 |
| Focus Digital | 27 Aug 2026 | $9.87 |
| get-ryze | 23 Aug 2026 | $45 to $120 |
| WebFX benchmarks | 24 Jun 2026 | $50 to $100+ |
| WebFX cost page | 16 Jul 2026 | $71.64 |
| Scorpion, personal injury | 4 Mar 2025 | $500+ |
Two pages ranking on the same query, WordStream at $9.87 and WebFX at $71.64, disagree by 10.6x on the same metric for the same vertical.
One note we will not paper over. We checked WebFX’s column header directly because $71.64 looked like a mislabelled cost per lead. The page states “Average CPC.” WebFX also lists Insurance at $67.73, Home Services at $40.87 and SaaS at $23.63, but Medical and Dental at $5.51 and Real Estate at $5.38. The top of that table sits an order of magnitude above the bottom in a pattern that looks like lead costs rather than click costs. We believe the high rows are mislabelled. We are reporting what the page says rather than silently correcting it, and you should treat those figures with the same caution.
The practical rule: for a US search account, expect roughly $2 to $6 CPC in most verticals, $8 to $12 in legal, insurance, finance and home services, and under $1 on Display. If a page quotes you a figure well outside that, check its date and its sample before you build a budget on it. Our own first-party CPC data, pulled from 16 live accounts, is in Bing Ads vs Google Ads: real CPC data from 16 accounts.
How much should I spend on Google Ads?
Not a dollar figure. A conversion figure, converted into dollars.
Every page in this category answers this with an invented round number: $1,000 a month, or $2,500, or “$100 to $10,000”. None of them explain where the floor comes from, so here it is.
Your minimum viable budget is whatever spend buys roughly 30 conversions a month at your cost per acquisition. That is not arbitrary. It is the volume Smart Bidding needs to steer, and it is roughly the volume you need before any performance number you read is signal rather than noise. Google’s own published minimum for Target ROAS on Search and Shopping is “At least 15 conversions in the past 30 days at the conversion tracking level” (Google Ads Help 6268637); 30 gives you room to survive a bad fortnight.
So the calculation runs backwards from what a customer is worth:
- What is a customer worth to you? Gross profit on a first order, or contribution margin if you know it.
- What can you pay to acquire one? Usually a third to a half of that, depending on repeat rate.
- What is your conversion rate from click to customer? If you do not know, use 2% to 3% for ecommerce and 5% to 10% for lead generation, then replace it with your own number within sixty days.
- Cost per conversion = CPC divided by conversion rate. At $4 CPC and a 3% conversion rate, that is $133.
- Minimum monthly budget = cost per conversion times 30. In that example, roughly $4,000.
Now the uncomfortable part. If step 5 gives you a number you cannot afford, Google Ads is not viable for you at that CPC in that vertical. That is a real answer and it is more useful than being told to start at $1,000. Your options are to narrow to cheaper, higher-intent keywords, raise what a customer is worth, or use a different channel.
Minimum viable budget by CPC and conversion rate
| Your CPC | 2% conversion rate | 5% conversion rate | 10% conversion rate |
|---|---|---|---|
| $1 | $1,500/mo | $600/mo | $300/mo |
| $2 | $3,000/mo | $1,200/mo | $600/mo |
| $4 | $6,000/mo | $2,400/mo | $1,200/mo |
| $8 | $12,000/mo | $4,800/mo | $2,400/mo |
| $12 | $18,000/mo | $7,200/mo | $3,600/mo |
Read your row, not the industry average. A legal firm at $10 CPC and a 5% form conversion rate needs around $6,000 a month before the account has enough data to optimise. Being told “start at $1,000” sets that advertiser up to fail and then conclude the channel does not work.
One official minimum does exist, and no cost page we reviewed cites it: Google enforces a minimum daily budget of 5 USD for all Demand Gen campaigns, applied through the Google Ads API from 1 April 2026. That is the only hard floor Google publishes. Every “$1,000 a month minimum” you read is somebody’s opinion.
What is my real total cost, not just ad spend?
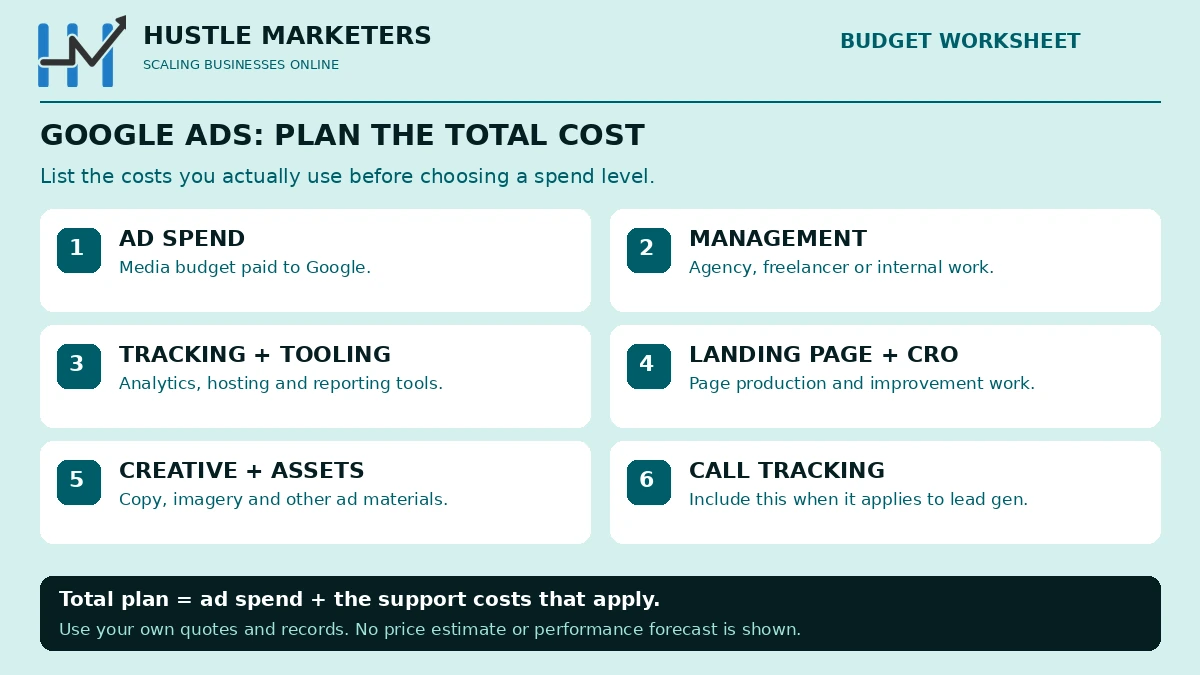
Your ad budget is not your cost. This is the section every other page in this category leaves out, and the reason is structural rather than accidental: almost every page ranking for this query is published by an agency that sells Google Ads management. Writing down the true total means writing “your real cost is 1.2 to 1.3 times your ad spend once you pay us”, and that suppresses the lead.
We are a small agency and we can afford to publish the number the large ones cannot.
Total cost of ownership at three spend levels
| Cost line | $1,000/mo spend | $5,000/mo spend | $20,000/mo spend |
|---|---|---|---|
| Ad spend to Google | $1,000 | $5,000 | $20,000 |
| Management, at 15 to 20% of spend | Usually a flat fee instead, $500 to $1,000 | $750 to $1,000 | $2,000 to $3,000 |
| Tracking and tooling | $0 to $30 (GTM free, server-side hosting if used) | $30 to $150 | $150 to $500 |
| Landing page or CRO | $0 if using existing pages | $0 to $500 | $500 to $2,000 |
| Creative and assets | $0 to $200 | $200 to $500 | $500 to $1,500 |
| Call tracking, if lead gen | $0 to $50 | $50 to $150 | $150 to $400 |
| Realistic total | $1,500 to $2,280 | $6,030 to $7,300 | $23,300 to $27,400 |
| Multiple of ad spend | 1.5x to 2.3x | 1.2x to 1.5x | 1.17x to 1.37x |
The pattern matters more than the figures. At small budgets the overhead dominates. A business spending $1,000 a month on ads and paying a $500 management fee is spending $1,500 to buy $1,000 of clicks, so a third of the budget never reaches the auction. That is the strongest argument for either running it yourself at that level, or waiting until you can fund a budget where the fee is proportionate.
Three common fee structures, so you can model your own:
- Percentage of spend, typically 10% to 20%. Scales with budget, and the incentive points toward spending more.
- Flat retainer, typically $500 to $5,000 a month. Predictable, and proportionally punishing at low spend.
- Hybrid, a base fee plus a percentage above a threshold. Common above $20,000 a month.
We publish our own fee structure rather than making you ask, in PPC management pricing, and the in-house versus agency versus freelancer arithmetic is in the 2026 cost math.
What determines how much you pay per click?
The auction, and specifically Ad Rank. Google documents six inputs, not the bid times Quality Score formula most guides still teach: your bid, ad and landing page quality, the Ad Rank thresholds, the competitiveness of the auction, the context of the search, and the expected impact of your assets and formats (Google Ads Help 1752122).
What that means in practice:
- You do not pay your bid. Search still runs a generalised second-price mechanic, so you pay roughly what is needed to beat the advertiser below you.
- Quality lowers cost. Better ad relevance, expected CTR and landing page experience mean a lower price for the same position. This is the only lever that reduces CPC without reducing visibility.
- Context changes price. Device, location, time and the exact query all move the auction. The same keyword genuinely costs different amounts at different times.
- Assets matter. Sitelinks, callouts and the rest are an Ad Rank input, not decoration.
The practical consequence is that two advertisers bidding identically on the same keyword can pay materially different amounts. If your CPC is above your industry benchmark, the first thing to check is quality, not bids. Our diagnostic order is in the Google Ads audit checklist.
How much does a lead cost in Google Ads?
The headline figure is $66.69, and it is the metric where the sources disagree most interestingly, because one of them disagrees with itself.
Published cost per lead, reconciled
| Source | Date | Overall CPL | Legal CPL |
|---|---|---|---|
| WordStream, cost page | 19 Aug 2026 | $66.69 | $131.63 |
| WordStream, 2025 benchmarks | 18 May 2026 | $70.11 | $131.63 |
| NinjaPromo | 6 Dec 2025 | $66.69 | $144.03 |
| WebFX PPC benchmarks, B2B only | Oct 2025 data | Manufacturing $819, SaaS $369, Professional Services $290 | Not stated |
Two things to take from that. WordStream reports two different overall CPLs on two live 2026 pages, $66.69 and $70.11. Neither is wrong, they are different samples, but it shows how little precision these figures carry. And WebFX’s B2B numbers are roughly 12x WordStream’s overall figure, which is not a contradiction at all: B2B leads genuinely cost that much more. Quoting an overall average at a B2B advertiser is the error.
So use segment figures, not overall ones. An overall CPL is an average across ecommerce micro-conversions and enterprise software demos, and it describes nobody.
What conversion rate and CTR should you budget against?
Use your own if you have ninety days of data. If you do not, here is what the sources say and how far apart they are.
Conversion rate and CTR, reconciled
| Metric | WordStream benchmarks | WebFX | Store Growers | Spread |
|---|---|---|---|---|
| Conversion rate | 7.52% | 3% to 5% | 2.81% | 2.7x |
| Click-through rate | 6.66% | 3% to 5% on one page, “~6.66%” on another | 3.17% | 2.1x |
| Cost per acquisition | Not stated overall | $50 to $80 overall, $20 to $50 ecommerce, $100 to $300 B2B | $45.27 | Wide |
| Return on ad spend | Not stated | 200% to 400% overall, 400% to 600% ecommerce | Not stated | Only one source publishes ROAS at all |
Note that WebFX publishes two different CTR figures on two of its own pages, one of which, “~6.66% across industries”, is WordStream’s number carried across without attribution. That is how a single dataset ends up looking like independent corroboration.
For budgeting, use the conservative end. Plan at 2% to 3% conversion rate for ecommerce and 5% to 10% for lead generation, then replace those with your own figures within sixty days. A budget built on a 7.52% conversion rate that turns out to be 2.5% is out by a factor of three, and you will conclude the channel failed when the model did.
Do Shopping and Performance Max cost the same as Search?
No, and most cost pages ignore the distinction entirely. Only one of the ten strongest pages we reviewed even has a Performance Max section, which is odd for a cost guide in late 2026.
- Shopping CPCs are typically lower than Search in the same vertical, because the click is driven by product and price rather than keyword competition. Published Shopping CTR sits around 0.8% to 1.2%, well below Search.
- Display is the cheapest per click, usually under $1, with a CTR around 0.05% to 0.1%. Cheap clicks are not cheap conversions, and Display budgets are where untracked spend most often accumulates.
- Performance Max blends all of it, so a single PMax CPC is an average across YouTube, Display, Search, Discover, Gmail and Maps. Channel-level reporting is now live, and reading it is the only way to know what you actually bought.
- Brand traffic inside PMax is the most common reason a PMax campaign looks cheap. It is buying clicks you would have got anyway at a lower price elsewhere, then reporting them as campaign performance.
If your blended cost per conversion looks better than your Search campaigns and you cannot explain why, check brand exclusions first. The method is in Performance Max brand exclusions setup, and the wider diagnostic is in Performance Max not performing.
What does your money actually buy at each spend level?
Two of the ten strongest pages touch this. Nobody writes the honest version, so here it is.
What each budget tier realistically gets you
| Monthly ad spend | What you are actually buying | What you cannot expect |
|---|---|---|
| Under $500 | Data, not customers. Enough clicks to learn which queries convert, in one tight campaign on exact-match bottom-funnel terms | Smart Bidding, meaningful volume, or a reliable read on anything within 90 days |
| $500 to $2,000 | A functioning single-campaign account, usually brand plus one high-intent non-brand theme | Channel diversification, Performance Max working properly, or fast learning |
| $2,000 to $10,000 | A real account: several campaigns, Smart Bidding with enough conversion data, room to test | Dominance in an expensive vertical. At $10 CPC this is still only 200 to 1,000 clicks |
| $10,000 to $50,000 | Diversification across Search, Shopping or PMax, and remarketing. Segmented structure. Statistically valid testing | Instant results. Bigger budgets still need the same learning period |
| $50,000+ | Market coverage, incrementality testing, and enough volume that structure and feed quality become the constraint rather than budget | Escape from the fundamentals. Bad tracking wastes money faster at scale, not slower |
The uncomfortable line in that table is the first one. Under $500 a month, in most verticals, you are buying information. That can be a perfectly rational purchase if you treat it as a test with a defined question. It is not a customer acquisition programme, and anyone who sells it to you as one is taking your money.
What does the learning period cost?
Every account burns money while Smart Bidding calibrates, typically two to six weeks, and no cost page budgets for it as a line item.
Plan for it explicitly. Expect your cost per conversion to run 20% to 50% above target during the first three to four weeks of any new campaign or after any significant bidding change. That is not waste, it is the price of the data the algorithm needs, but it should be in the budget rather than a surprise in month one.
Two practical consequences. Do not judge a campaign before the learning period closes, and do not reset it by changing targets weekly. Every material change to a bid strategy restarts the clock, which is how accounts end up permanently in learning and permanently expensive.
Where does wasted spend actually go?
WordStream puts average wasted spend at $1,127.54 a month against average account spend of $3,127.38. That is roughly 36% of the budget, and the figure is widely quoted without anyone explaining where it goes.
In the accounts we take over, it goes to six places, in this order:
- Search terms that never convert. Broad match with no negative list, running for months. Usually the single biggest line.
- Job seekers, students and researchers. Queries containing jobs, careers, salary, free, DIY, tutorial and how to make.
- Geography nobody checked. Location targeting left on “Presence or interest” instead of “Presence”, buying clicks from people merely reading about your city.
- Brand traffic bought at a premium inside Performance Max, with no brand exclusions, then credited to PMax as if it were incremental.
- Broken or duplicated conversion tracking, which sends the bidding algorithm after the wrong thing entirely.
- Campaigns still running for products or services the business no longer sells.
The arithmetic worth doing before you raise budget: if 30% of your spend is recoverable, cutting it is equivalent to a 43% budget increase and costs nothing. Most accounts should exhaust that before adding money. The method for finding it is section 6 of the audit checklist, and the tracking half is in the conversion tracking guide.
What changed in 2026 that affects what you pay?
Three changes, and the biggest of them appears on zero of the ten strongest cost pages we reviewed, including one updated twelve days before the change landed.
2026 changes that move your cost
| Change | Date | Effect on what you pay |
|---|---|---|
| AI Max auto-upgrades began for Search campaigns using automatically created assets or campaign-level broad match | 1 Sep 2026 | Changes which queries you match on, so it changes your CPC, your mix and your conversion rate. You may be buying different traffic than last month without having changed anything |
| Enhanced CPC removed for Search and Display. Google’s wording: “Effective the week of March 31, 2025 Enhanced CPC (ECPC) is no longer available for Search and Display campaigns” (Google Ads Help 2464964). Unmigrated campaigns defaulted to Manual CPC | Week of 31 Mar 2025 | Accounts that fell back to Manual CPC have been unmanaged on bids since. A live cost problem 18 months later |
| Demand Gen minimum daily budget of $5 enforced via the Google Ads API | 1 Apr 2026 | The only official minimum Google publishes, and nobody cites it |
| First click, linear, time decay and position-based attribution removed | Nov 2023 | You can no longer switch models to sanity-check a CPA. Your cost per conversion means something different than it did, and no cost page says so |
On Enhanced CPC, one live page we reviewed still listed it as a current bidding strategy on an update dated 23 August 2026, seventeen months after removal. Part of the reason is that Google still hosts two live ECPC help pages that rank well, so writers find them and assume they are current. Worth knowing before you take a bidding recommendation from any page without checking its date.
AI Max is the one to act on. If your CPC or conversion rate stepped in September with no account change, check whether your Search campaigns were upgraded, and compare before and after the upgrade date from change history rather than month over month.
When is Google Ads not worth it?
Every page in this category closes with a soft “is it worth it” that resolves to yes, followed by a pitch. Here are the conditions under which the honest answer is no.
- Nobody searches for what you solve. If your category has no meaningful search volume, Google Ads cannot manufacture demand. Paid social or outbound is the channel, not search.
- Your cost per conversion exceeds what a customer is worth. Run the calculation above. If the floor is above your margin, the channel is not viable at that CPC.
- You cannot measure conversions. Running Smart Bidding without reliable conversion tracking is paying Google to optimise toward a number that is wrong.
- You cannot answer the leads. Lead generation accounts with slow or absent follow-up burn budget converting people who then go elsewhere. Fix the response time first, it is cheaper.
- Your budget is below the floor for your vertical and you are not treating it as a test. Underfunded accounts do not produce a smaller version of the result, they produce noise.
- Your landing page does not work. Paid traffic multiplies whatever your page already does. If it converts at 0.5% organically, paid will not fix that.
There is also a cost to stopping that nobody discusses. Pause an account and you lose auction history, your remarketing lists decay, and restarting means paying for the learning period again. Treat Google Ads as something you start when you can sustain it, not something you switch on and off monthly.
How do daily budgets and monthly charges actually work?
Two things confuse people here and both cost money when misunderstood.
Google can spend more than your daily budget on a given day. It does this deliberately, spending up to twice your daily amount when it sees an opportunity, and balances it out across the month. Your monthly charge is capped at your average daily budget multiplied by 30.4, the average number of days in a month.
So a $50 daily budget is really a $1,520 monthly ceiling, and seeing $92 spent on a Tuesday is not an error.
Budgets are set at campaign level, not account level, unless you use a shared budget. This is where money quietly goes wrong: a profitable campaign sits Limited by budget while an underperforming one runs uncapped. Check the status column before you add money, because reallocating usually beats increasing.
Two practical rules. Set the daily budget from the monthly number you can sustain, divided by 30.4, not by 30. And never leave a campaign Limited by budget without a deliberate decision, because that status means the auction wanted to give you more of something you already decided was worth buying.
Does a bigger budget get you a lower cost per click?
No, and it is worth being clear because the assumption is common.
Budget controls how many auctions you enter. It does not change the price of any individual auction. What actually lowers your CPC is better quality, better targeting, and buying cheaper intent.
What a bigger budget does buy is faster learning and more coverage. More conversions per month means Smart Bidding steers better and your data becomes reliable sooner. That is a real advantage, and it is why the same campaign often performs better at $10,000 than at $1,000. But the mechanism is data, not discounting.
The corollary matters more: if you are spending too little to generate 30 conversions a month, adding budget can genuinely improve efficiency by getting you over the data threshold. Above that point, adding budget buys volume at a stable or slightly worse efficiency, because you are reaching further into less-qualified demand.
How much do Google Ads agencies charge on top?
Short version, with the detail on its own page so this one does not turn into a pitch.
- Percentage of spend: 10% to 20% is standard in the US market, sometimes with a floor.
- Flat retainer: $500 to $5,000 a month depending on account complexity, not just spend.
- Hourly consulting: $100 to $300 an hour, varying by credentials.
- Hybrid: base fee plus a percentage above a threshold, common above $20,000 a month.
The ratio is what matters. At $1,000 of ad spend a $500 fee is 50% overhead. At $20,000 a $3,000 fee is 15%. There is a level below which paying for management is hard to justify arithmetically, and honest agencies will tell you where it is.
Full breakdown, including what should be included at each tier and what to watch for in a contract, is in PPC management pricing. If you are weighing an agency against hiring, PPC agency vs in-house vs freelancer has the real cost comparison including salary, tooling and ramp time.
Frequently asked questions
How much does Google Ads cost per month for a small business?
Most US small businesses spend between $1,000 and $10,000 a month, with $1,000 to $2,500 the usual starting range. WordStream’s study of over 15,000 accounts puts the average at $3,127.38 a month. But the useful figure is your own floor: roughly 30 conversions a month at your cost per conversion. Work that out before you pick a round number.
What is a good cost per click in Google Ads?
There is no good CPC in isolation, only a CPC relative to what a conversion is worth to you. As a benchmark, most US verticals run $2 to $6, legal, insurance, finance and home services run $8 to $12, and Display is usually under $1. If you see a page quoting $2.69 as the 2026 average, that is republished 2018-19 data.
Is there a minimum budget for Google Ads?
Google publishes exactly one hard minimum: $5 a day for Demand Gen campaigns, enforced through the Google Ads API from 1 April 2026. Every other minimum you read, including the common “$1,000 a month”, is somebody’s opinion. Your real floor is whatever spend produces enough conversions for the bidding to work.
Why is my cost per click higher than the industry average?
Usually quality rather than bids. Ad Rank has six documented inputs, and ad relevance, expected CTR and landing page experience all move what you pay for the same position. Check those before raising or lowering bids. Also check whether you are bidding on broader intent than the benchmark assumes, since averages are dominated by high-intent bottom-funnel terms.
Do I pay Google Ads monthly or per click?
Per click, charged monthly. You are billed when you hit a payment threshold or at the end of the billing period, whichever comes first. Your monthly charge cannot exceed your average daily budget times 30.4, even though individual days can run up to twice the daily amount.
How much should I spend on Google Ads to see results?
Enough to generate roughly 30 conversions a month, which is the point at which Smart Bidding has enough to steer and your numbers stop being noise. At $4 CPC and a 3% conversion rate, that is about $4,000 a month. At $1 CPC and a 10% conversion rate, about $300. Your vertical decides, not a general rule.
Why do different websites give completely different Google Ads costs?
Because they are quoting different datasets from different years and most do not say which. Published averages for the same metric range from $1.00 to $5.42, and the widely repeated $2.69 is a 2018-19 figure still being republished under 2026 update stamps. Check the date and the sample size on any benchmark before you build a budget from it.
Is Google Ads worth it for a small business?
It depends on whether people search for what you sell and whether you can afford the floor. If your category has search volume, you can measure conversions, you can answer leads promptly and your minimum viable budget is within reach, then usually yes. If any of those are false, the honest answer is no, and no amount of optimisation fixes a channel mismatch.
How we compiled these figures
Hustle Marketers is a US-focused paid media agency. The budget arithmetic and the total cost of ownership model in this guide come from accounts we run and accounts we take over.
The reconciliation tables are a different kind of work and we want to be precise about it. We reviewed roughly fifty pages currently ranking for this topic, extracted every published benchmark figure with its stated date and any stated methodology, and compared them. Where sources disagree, we show the disagreement and quantify it rather than picking the number that suits us. Where a figure looks mislabelled, as with one source’s legal CPC, we say so and report what the page actually states rather than silently correcting it.
Two things we are careful about. We have not verified the underlying data of any third-party benchmark, only what each page publishes and what methodology it discloses. And our own tier and total-cost tables are practitioner guidance from our client work, not survey data, which is why they are presented as ranges rather than precise figures.
Where we do have first-party data with a stated sample, we publish it with the methodology attached: real CPC data from 16 accounts, and the 2026 Performance Benchmark Report covering 44 client engagements across more than 20 verticals, including its own disclosure that it is a ceiling dataset rather than a market average.
Google revises its documentation and its products without notice, and several figures in this guide have already changed once this year. Re-check anything you plan to put in front of a client, and if you find something here that has gone stale, tell us and we will correct it and date the change.
Changelog. 13 September 2026: first publication. Benchmarks reconciled as of this date. AI Max auto-upgrade and the Demand Gen $5 daily minimum added.
Want the number for your business rather than the average?
Averages are a starting point and a poor one. What decides your budget is your margin, your conversion rate and your CPC, and those three are knowable in an afternoon.
If you want us to work out your minimum viable budget and what it would realistically produce, get in touch. We will do it against your own numbers before anyone talks about a retainer.
If you do not want to rebuild this budget model every quarter, that is the job our PPC management service does, and our Google Ads agency page sets out what the fee covers before anyone quotes you a retainer.
Related reading: PPC management pricing, agency vs in-house vs freelancer cost math, the Google Ads audit checklist, conversion tracking setup, Bing vs Google CPC data, 2026 benchmark report, Google Ads cost in India, optimization checklist.
Summarise this article with: