PPC Reporting in 2026: What to Include and What Your Tool Cannot Show You

Ishant
Published : September 28, 2026 at 11:30 am
Updated : October 7, 2026 at 8:09 am
Ishant

We read twenty-four of the pages currently ranking for PPC reporting. Fourteen of them name the tool most agencies build reports in. Thirteen call it Looker Studio. Google renamed it back to Data Studio in April 2026, so that is a 93 percent staleness rate on the single most-named product in the category. One of those pages was updated six days ago and still says it fifteen times, including in a heading.
That is a symptom, not the problem. The real problem is that not one page in twenty-four explains what the numbers in a PPC report actually mean, or where they are wrong. Zero cover modelled conversions. Zero cover the fact that Google reports conversions against the click date, so every report you send keeps changing after you send it. Zero mention that Google removed the Auction Insights fields from the reporting connector in 2024, while several of them still imply you can build the competitor dashboard those fields would require.
Every strong page in that SERP is published by a company selling a reporting tool. None of them has a commercial reason to write “here is what your reporting tool cannot show you.” We are an agency, so we can.
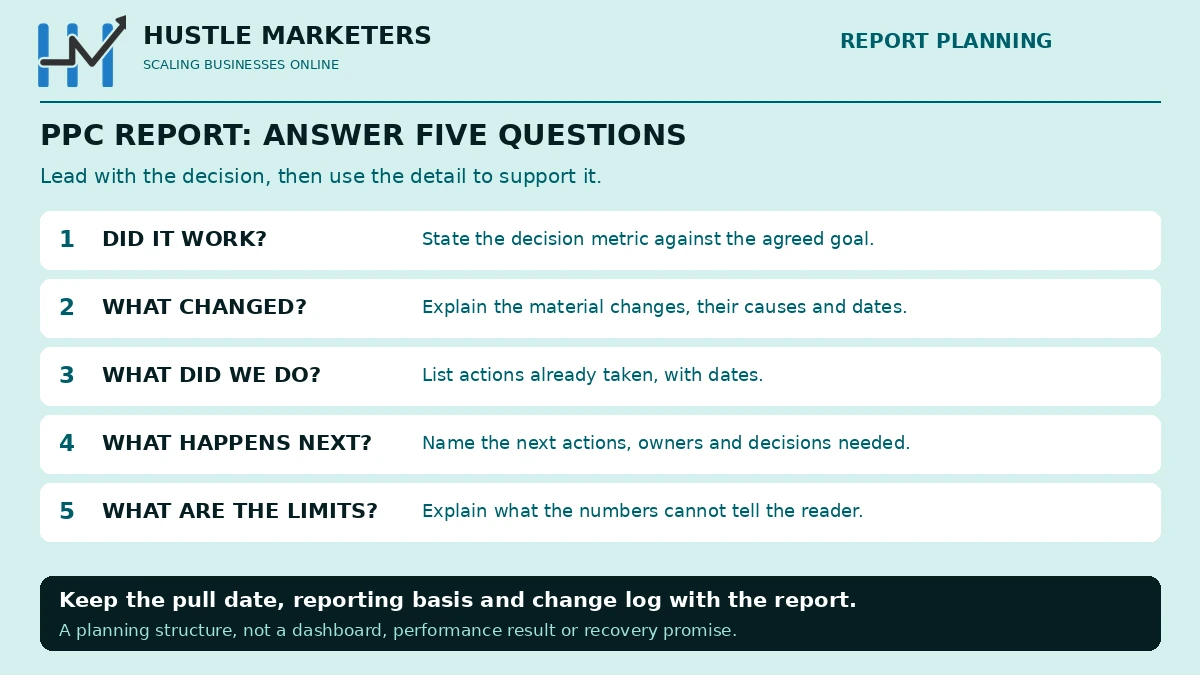
What should a PPC report include?
Five things, in this order. Everything else is decoration.
- The answer to “did this work”. One number, on the first screen, against the goal. Not a metric grid.
- What changed and why. Three to five things, each with a cause. Not a wall of month-over-month deltas.
- What you did about it. Actions taken, dated.
- What happens next. A short plan with owners, not a list of aspirations.
- What the numbers cannot tell you. The section nobody includes, and the one that protects you.
Notice what is not on that list: a screenshot of every campaign, a keyword table nobody reads, and a Quality Score average. The most common reporting failure is not omitting something. It is including everything, which buries the answer and teaches the client that the report is homework rather than a decision.
Our standing rules for what goes into a client document are published at the Reporting Integrity Standard, including account ownership, raw platform access and fee disclosure.
Which PPC metrics actually matter, and to whom?
The single biggest reason reports get ignored is sending the same one to everybody. A finance director and a paid search manager need different numbers, and giving each of them the other’s report guarantees neither acts on it.
PPC metrics by audience
| Audience | What they need | What they do not need | The one number |
|---|---|---|---|
| Owner, CFO or board | Revenue or qualified leads, total cost including fees, blended return, payback | CTR, Quality Score, impression share, keyword tables | Profit contribution, or cost per acquired customer against target |
| Marketing lead | Conversions, CPA, ROAS, spend pacing, channel mix, what changed | Ad-level data, search term detail | CPA or ROAS against target, trended |
| PPC practitioner | Search terms, impression share lost to rank vs budget, asset performance, bid strategy status | Executive summaries | Whatever is currently capping the account |
| Client’s agency partner, white label | Agreed KPIs, delivery against scope, flagged risks | Internal working notes | The committed metric, with variance explained |
The practical rule: one report, three depths. Page one answers the executive question. Pages two and three carry the operating detail. The appendix carries the raw tables for anyone who wants to check your work, and somebody occasionally will.
What are the core PPC KPIs, and how are they actually defined?
This is where the ranking pages contradict each other, so definitions matter more than usual.
The core PPC metrics, defined
| Metric | Definition | The trap |
|---|---|---|
| Impressions | Times your ad was served | Not reach. The same person counts repeatedly |
| Clicks | Times someone clicked | Google Ads counts clicks, GA4 counts sessions. They will never match |
| CTR | Clicks divided by impressions | High CTR on broad, irrelevant traffic is a warning, not a win |
| CPC | Cost divided by clicks | You pay to beat the Ad Rank below you, not your bid |
| Conversions | Actions you marked primary | Includes modelled estimates, see below |
| Conversion rate | Conversions divided by interactions | Google Ads uses interactions, not clicks, and not users. GA4’s conversion rate is a structurally different number |
| CPA | Cost divided by conversions | Changes entirely depending on which conversion actions are set to primary |
| ROAS | Conversion value divided by cost | Report it as a ratio (5.0) or a percentage (500%). Not as a bare 500 |
| Impression share | Share of eligible auctions you appeared in | Split it into lost to rank and lost to budget, or it tells you nothing |
| Quality Score | A one-to-ten diagnostic on keywords | Google: “Quality Score is not an input in the ad auction” |
Three of those deserve expanding, because the ranking pages get them wrong.
ROAS. One widely-read page publishes the formula as revenue divided by spend, times 100, and presents the result as a bare number. Follow that literally and you will report 500 where the answer is 5.0. Google Ads reports ROAS as a ratio, or as a percentage if you switch the column. Pick one and label it.
Quality Score. Five of the pages we read list it as a headline KPI, and one asserts that raising it lowers your CPC as a matter of cause and effect. Google’s own wording is blunter: “Quality Score is a diagnostic tool meant to give you a sense of how well your ad quality compares to other advertisers,” and “Quality Score is not an input in the ad auction” (Google Ads Help 6167118). An account-average Quality Score in a client report is close to meaningless. Report the components on keywords carrying real spend, or leave it out.
Average position. Google sunset it in September 2019 and replaced it with top impression rate and absolute top impression rate. Four of the pages we reviewed still list it, including two template galleries that ship it as a field. If your dashboard has an Average Position widget, it has been showing you nothing for seven years.
Which metrics should you leave out?
Every page in this category tells you to cut vanity metrics and then lists the same seven metrics anyway. The useful test is not whether a metric is vain. It is whether a change in that metric would change a decision.
The leave-out test
| Metric | Keep it when | Cut it when |
|---|---|---|
| Impressions | You are diagnosing reach loss or a sudden delivery change | It is on page one of a client report |
| CTR | You are judging ad copy or a specific ad group | It is presented as an account-level success measure |
| Quality Score | You are looking at components on high-spend keywords | It is an account average |
| Average CPC | Combined with conversion rate and CPA | On its own. A falling CPC with a falling conversion rate is worse traffic, not a saving |
| Bounce rate | You are checking a specific landing page after a change | It is in a paid media report as a headline. It measures the site, not the campaign |
| Impression share | Split into lost to rank and lost to budget | As a single percentage. The split is the whole insight |
| Clicks | Almost never on page one | As the headline number. It is the thing you paid for, not the thing you got |
| Keyword tables | The account is keyword-driven and you are explaining a specific shift | In an AI Max or Performance Max account, where the keyword is no longer the unit of control |
The harder version of this rule: if you would not change anything in response to a metric moving twenty percent, it belongs in the appendix. Clients do not distrust reports because they are short. They distrust them because they cannot tell which number they are supposed to act on.
How do you build a PPC report, step by step?
Seven steps. The order matters, because most reporting problems come from writing the commentary after the charts are already built, which means the charts decide what the story is.
- Agree the decision metric before the period starts. One metric, one target, in writing. Blended return on total spend for ecommerce, cost per qualified lead for lead gen. Everything else is a diagnostic.
- Fix the reporting basis. Account time zone, date range definition, attribution model, and which conversion actions are primary. Write those four into the footer once and do not change them silently.
- Pull on a fixed day, and stamp it. Wait long enough after month end for click-date conversions to land, usually three to five days for most accounts, and record the pull date and time.
- Reconcile before you write. Compare Google Ads against GA4 against the store or CRM. You are not looking for agreement, you are looking for whether the gap is the same as last month.
- Write page one first, from the numbers, before you build any chart. The headline, what changed, what you did, what you need. If you cannot write it, you have not finished step 4.
- Build the supporting pages to evidence page one. Every chart on pages two and three should exist because a sentence on page one needs it. Delete any chart that does not.
- Snapshot and log. Export the fixed version, file it, and add the period’s account changes to the change log.
Step 5 is the one that separates a report from a dashboard export. A dashboard shows what happened. A report says what it means and what you want done about it.
Why does last month’s report keep changing after you send it?
Because Google reports conversions against the date of the click, not the date the conversion happened. This is the single largest omission in this category: zero of the twenty-four pages we read mention it, and it is the mechanism behind the most common client argument in paid search.
Google’s own wording: “The primary conversion columns mentioned above are calculated based on the time of the click, not the time of the conversion.” The worked example on the same page: “if your ad was clicked on last week and that traffic converted this week, both the click and the conversion are reported back to last week in the primary conversions columns” (Google Ads Help 6270625).
Google is even more direct on its data discrepancy page: “Google Ads reports conversions on the ad impression date. Other reporting tools attribute them to the conversion date. This is called a conversion delay.” And conversions “can be reported up to 90 days after the click” (Google Ads Help 7457111).
Three consequences for anyone who sends reports:
- A recent period always looks worse than it is. Conversions that will be backdated into it have not landed yet. Reporting last week on Monday is reporting an incomplete number.
- Last month’s CPA keeps improving after month end. Re-pull the same date range three weeks later and it will have moved.
- A client who screenshots your report can later “prove” you changed the numbers. They did change. You did not change them.
What to do about it. Put the pull date and time on every report. Use the conversion-time columns when you reconcile against a store or CRM, and the click-time columns when you judge bidding, because click-time is what the algorithm optimises against. And tell the client this once, in writing, before it becomes an argument rather than after.
Are the conversions in your report even real?
Some of them are estimates, and Google says so. Zero of the twenty-four pages we read mention this.
From Google’s documentation on modelled conversions: “In the ‘Conversions’ column, Google reports both modeled and observed conversions.” Google gates inclusion on confidence, “We only include modeled conversions in our reporting when we’re highly confident that conversions actually occurred as a result of ad interactions,” and notes that low-volume accounts get none at all: “for some users, we don’t observe enough conversions on a regular basis to be able to confidently model. In these cases, we don’t report any modeled conversions” (Google Ads Help 10081327).
Two things follow. First, a Google Ads conversion count that runs above your store’s order count is not automatically a tracking bug. Second, and this is the part that matters for reporting, small accounts are reported on differently from large ones. If your client is under the modelling threshold, their numbers are observed-only while their competitor’s are not, and any benchmark comparison between them is not like for like.
You cannot switch modelling off, and you should not want to. What you can do is disclose it. One line in the methodology note is enough: “Google Ads conversions include modelled estimates for conversions Google could not directly observe. This is why they will not match the store exactly.” The full reconciliation method is in why Google Ads, Meta and GA4 report three different numbers.
Why do Google Ads, GA4 and the store never agree?
This is the most-asked question across every community source we searched, and every ranking page treats reporting as a presentation problem rather than a data question. Four structural reasons:
- Date basis. Google Ads files the sale under the click date. GA4 files it under the day it happened.
- Modelling. Google Ads includes estimates. GA4 reports observed events.
- Attribution scope. In GA4, the Google Ads reports default to Google Paid attribution while the Analytics reports default to Paid and Organic, so the two GA4 views disagree with each other before either one meets Google Ads.
- Time zone. Google Ads uses the Ads account time zone, GA4 uses the property time zone. If they differ, every month boundary is wrong at the edges.
Add the client’s own fiscal calendar and you have four different definitions of “September”. Decide which one the report runs on, state it, and never silently change it.
Our answer in client documents is to name one decision metric, usually blended revenue over total marketing spend straight from the books, and present platform numbers alongside it as clearly-labelled diagnostics. The gap between them is then reported as its own line with a stable baseline, so a change in the gap becomes a signal rather than an accusation.
What your reporting tool cannot show you
No page in this category covers this, and the reason is structural: they are all published by reporting tool vendors. Here is what Google has actually removed from the connector, with dates.
Fields Google removed from the Data Studio connector
| What was removed | When | What it means for your report |
|---|---|---|
| All 12 Auction Insights fields, including Auction Insight Domain, Overlap Rate, Position Above Rate, Outranking Share, Abs. top of page rate, and the Shopping equivalents | New data sources from 24 Aug 2024, existing sources from 23 Sep 2024 | You cannot build an automated competitor-comparison dashboard. It is a manual export from the interface, every month, permanently |
| 16 location extension fields across the Google Ads and New Search Ads 360 connectors: 8 affiliate-location and 8 store-location, covering address, business name, city, country code, phone, postal code and province | Deprecated 30 Apr 2026, stopped serving 4 May 2026 | Any location report built before May 2026 is now returning nothing. Migrate to the Asset location fields |
Google’s connector documentation carries the Auction Insights notice in its current wording: “Starting on August 24, 2024, Auction Insights fields won’t be available for new data sources in Data Studio.” Google gave no stated reason at the time.
The API route is closed too. The six Auction Insights metrics in the Google Ads API sit behind an allowlist, and Google’s own staff have said on the record in the developer group that “the ‘auction insights metrics’ feature is available only for the allowlisted accounts in the Google Ads API” and that “the whitelisting program for this particular feature is currently closed, so we’re unable to add new people to have access at this time,” with no timeline offered. We have seen the error code for this reported as a specific enum in third-party write-ups but could not confirm that from a Google source, so we will say only that the API returns an access-denied response.
One distinction nobody makes, and it is the most consequential in this whole category: search impression share is still available in the connector. The Auction Insights share metrics are not. They sound like the same thing. Several ranking pages list impression share among their dashboard metrics in a way that implies you can build the competitor view, and any reader who tries will hit a wall with no warning.
If you need competitive share in a client report, the honest answer is a monthly manual export. How to read it once you have it is in how to read the Auction Insights report.
How far back can your report honestly go?
Nobody in this category covers retention as a reporting constraint, which is why so many twelve-month trend charts quietly contain months that are not actually there.
What limits a long trend chart
| Constraint | The limit | What breaks |
|---|---|---|
| Performance Max channel data | Data exists only for dates on or after 1 June 2025 | Any PMax channel comparison against the same period a year earlier before mid-2026 has no data on one side |
| GA4 event data retention | Standard properties offer 2 or 14 months. Longer windows, 26, 38 and 50 months, are 360 only | A two-year GA4 trend on a standard property is not available in exploration reports. Check the property setting before you promise it |
| Search terms report | Google omits low-volume terms: “Some search terms that don’t have enough query activity are omitted from the search terms report in order to keep with our standards on data privacy” | Your search terms will never sum to your campaign totals. This is not a tracking fault, and it is worth a footnote before a client counts it themselves |
| Search terms themes | “labels for the themes and subthemes are generated from the last 56 days of data” | Theme labels are a rolling 56-day view, not a like-for-like historical field |
| Conversion backfill | Conversions report up to 90 days after the click | The most recent three months of any trend are still moving. The last month is the least reliable point on the chart, and it is the one clients look at |
Two practical consequences. First, build your own history. If a client will want a two-year view, start exporting monthly snapshots into a sheet now, because the platforms will not hold it for you. Second, label the floor on every long chart. A vertical line and a four-word note is enough. A chart that silently starts flat because there is no data before a date is the kind of thing a client notices three months later, and it costs more trust than admitting the limit would have.
What does the AI Max upgrade do to your reporting?
Zero of the twenty-four pages we read mention AI Max. Auto-upgrades began on 1 September 2026, which means a campaign in the account you are reporting on this month may have changed type without anyone approving it.
Google’s stated timeline: “Beginning September 1, Google will automatically upgrade Search campaigns using Campaign-level Broad Match or standalone Automatically Created Assets to AI Max.” Dynamic Search Ads campaigns follow between 1 and 28 February 2027 (Search Engine Land, 14 August 2026).
Three reporting consequences, none of which appear anywhere in this category yet.
- Your campaign-type column may be inconsistent inside a single reporting period. A month that straddles the upgrade contains two different campaign types under one campaign name. Any month-over-month comparison across that boundary is comparing two different things.
- Keyword-level attribution gets thinner. The three legacy features being migrated are Campaign-level Broad Match, Automatically Created Assets and Dynamic Search Ads. All three already loosened the keyword-to-query link. AI Max loosens it further, so a keyword performance table becomes a weaker explanation of what actually happened.
- The search terms report becomes the primary diagnostic, not the keyword report. If your template leads with keywords, it is leading with the least reliable surface in an AI Max account.
What to do before your next report. Check the campaign type column in the account, not in your dashboard, and note the date any campaign changed. Then put a one-line note in the report: “Campaign X was upgraded to AI Max on [date]. Figures before and after that date are not directly comparable.” That single line prevents the conversation where a client asks why performance changed and you have no answer that does not sound like an excuse.
How do you report on Performance Max without guessing?
Performance Max reporting improved in 2026, and almost nobody has updated their reporting guidance to match. One page in twenty-four ships a PMax tab. None covers the two caveats that decide whether the data is usable.
Google’s developer blog, 29 January 2026: “Starting with v23, you can now retrieve performance data broken down by channel, such as Google Search, Search Partners, GMail, YouTube, Display, Discover, and Maps” (Google Ads Developer Blog). Before this, ad_network_type simply returned MIXED for every Performance Max row, which is why PMax felt like a black box for three years.
The two caveats:
Performance Max channel reporting, what you can and cannot show
| Question | Answer | What it means for the report |
|---|---|---|
| How far back does channel data go? | “Performance reports will only return channel-level data for dates on or after June 1, 2025” | No year-on-year channel comparison is possible before June 2026. Any YoY chart covering PMax channels in the first half of 2026 is comparing against nothing |
| Can I get asset group level channel data in the interface? | “Reporting at the asset group level is exclusive to the API and will not be available in the Google Ads web interface” | If your reporting tool pulls from the interface rather than the API, asset group channel splits are not coming. Check which your connector uses before promising it |
| Where is the client-facing version? | The channel performance report in the Google Ads interface (Google Ads Help 16260130) | Campaign-level channel split is available to anyone with account access. Use it |
Practical version for a monthly client report: show the channel split at campaign level, label the June 2025 floor anywhere you show a trend, and stop presenting Performance Max as a single line item. A PMax campaign spending sixty percent on YouTube and forty percent on Search is two campaigns wearing one name, and the client is entitled to see that.
If the campaign itself is the problem rather than the reporting, the diagnostic order is in Performance Max not performing.
How do you explain a bad month?
Twenty-two of the twenty-four pages we read have nothing on this. One gives it a paragraph. It is the highest-anxiety moment in the entire client relationship and the category is effectively empty.
The instinct is to lead with context and arrive at the bad number slowly. That reads as hiding. The client already knows, because they can see the revenue. Lead with it.
The structure that works
| Step | What you write | What you do not write |
|---|---|---|
| 1. State it | “CPA was $64 against a $45 target. That is the worst month since March.” | “Performance was mixed this month” |
| 2. Split cause | Separate what you control from what you do not: bid changes, budget, landing page downtime, tracking break, seasonality, competitor entry, policy disapproval | A single vague cause. There is almost never only one |
| 3. Evidence each cause | Impression share lost to rank vs budget, auction insights export, search term shift, GSC or server logs for site issues, the date a competitor’s ads first appeared | Attributing it to “the algorithm” |
| 4. Say what you already did | Dated actions, taken before the report, not proposed in it | A list of things you will do next month |
| 5. Say what you need | A decision, a budget change, a landing page fix, an approval, with a date | “Let us keep monitoring” |
| 6. Give the honest forecast | A range with the assumption stated | A recovery promise |
Two rules that matter more than the structure. Never let the client discover a bad month from the invoice. If you know on the 9th, the message goes out on the 9th, not in the month-end report. And never explain a bad month with a metric that improved. Pointing at a rising CTR while CPA doubles is the single fastest way to lose a client’s trust in every number you have ever sent them.
Where the bad month is caused by a competitor rather than by the account, the evidence you need is in how to run a PPC competitor analysis.
How often should you send a PPC report?
Monthly is the default across this entire category, and it is right for most accounts. The useful question is not the interval, it is which document goes out at which interval.
Reporting cadence by spend and account type
| Cadence | Who it suits | What it contains | What it is not |
|---|---|---|---|
| Live dashboard | Every account, always on | Spend pacing, conversions, CPA or ROAS against target | Not a report. Nobody reads a dashboard on your behalf |
| Weekly, 3 to 6 lines | Spend above roughly $10k a month, or any account inside its first 90 days | Pacing, one thing that changed, one thing you are watching | Not a metrics table |
| Monthly, full | Almost everyone | The five things in the list at the top of this page | Not a data dump with a covering note |
| Quarterly, strategic | Retainer clients, anyone with a board | Trend, channel mix, cumulative return, what to change next quarter | Not a longer monthly |
| Immediate, ad hoc | Tracking breaks, policy suspensions, competitor entry, a bad month you can already see | What happened, impact, what you did, what you need | Never bundled into the next scheduled report |
The failure mode is reporting more often to look busy. A weekly full report trains the client to read noise as signal, because at weekly granularity almost all variance is noise, and it also guarantees they will ask you about a number that is still moving because of the click-date effect above.
One thing to fix on your side regardless of cadence: agree the reporting day and stick to it. A report that arrives on a different date each month reads as something you get around to. Cadence by account size for partner-delivered work is broken down further in white label PPC reporting.
How do you make a report defensible six weeks later?
Because of the click-date basis explained above, the same report regenerated later shows different numbers. Nobody in this category covers what to do about that, and it is the reason agency reporting arguments are usually unwinnable even when the agency is right.
Four habits fix it permanently.
- Stamp the pull. Every report carries the date and time the data was extracted, and the account time zone. One line in the footer.
- Snapshot, do not regenerate. Export the report as a fixed PDF or a frozen sheet at the moment you send it. A live dashboard link is a supplement, never the record.
- Footnote the columns. Say which conversion actions are counted as primary, which attribution model is in use, and whether the figures are click-time or conversion-time. Four short lines that make the numbers reproducible.
- Keep a change log. Bid strategy changes, budget changes, conversion action changes, landing page changes, tracking changes, each with a date. When a number moves six weeks later, the log is what turns “the numbers changed” into “here is exactly why.”
The test to apply: if a new analyst picked up your report and the account, could they reproduce every figure on page one? If not, it is not a report, it is a screenshot.
Should the client have their own account access?
This question does not appear on a single ranking page, and it is one of the most asked questions about PPC reporting anywhere. The phrasing in the wild is blunt: do agencies give you standard or read-only access, or just send a monthly report and block you from seeing your own data.
It is a trust question wearing a technical costume, and the answer decides how every report you send is read.
Our position, and we think the only defensible one: the client owns the Google Ads account, the Merchant Center account, the GA4 property and the conversion tracking, and they hold admin on all of them. The agency is granted access, not the other way around. That is written into our Reporting Integrity Standard alongside fee disclosure and raw platform access.
Two objections come up, and both have answers.
“The client will see numbers that differ from the report.” They will, and that is a reason to explain the difference once rather than to withhold access. The differences are all covered above: click-date basis, modelled conversions, primary versus secondary conversion actions, time zone, date range, and the same class of mismatch is behind why automated reports never match Search Console on the organic side. Put those four lines in the methodology footer and the objection disappears.
“The client will change things.” Read-only access solves this completely for anyone who is not paying the invoices, and admin plus an agreed change process solves it for the owner. Neither requires locking someone out of their own advertising data.
If an agency will not give you access to an account you are paying for, that is not a reporting preference. It is a switching cost being built on purpose.
How does reporting differ for ecommerce and lead generation?
Most guidance in this category treats them as one problem with a different metric swapped in. They are structurally different reporting jobs.
Ecommerce vs lead generation reporting
| Ecommerce | Lead generation | |
|---|---|---|
| Decision metric | Blended return on total marketing spend, or profit contribution | Cost per qualified lead, not cost per form fill |
| Where truth lives | The store or the accounting system, not the ad platform | The CRM, at the stage the client actually cares about |
| The reconciliation problem | Platform revenue versus store revenue. Expect a persistent gap and baseline it | Platform conversions versus CRM leads versus qualified leads. Two gaps, not one |
| The metric that misleads most | ROAS, because it ignores margin. A 4x ROAS on a 20 percent margin product loses money | Conversion rate, because it rewards volume of low-quality leads |
| What to add | POAS or contribution margin where margin data exists, new versus returning customers, product or category level performance | Lead quality by source, time to conversion, pipeline or closed revenue where the CRM supports it |
| Time lag | Short. Most of the value lands within the click window | Long. A lead in January can close in April, so a monthly CPA is a leading indicator, not a result |
| The uncomfortable conversation | Revenue attribution across channels | Whether sales is following up the leads at all |
The lead generation case has a trap worth naming. If the client will not share CRM outcomes, you are reporting on form fills and calling it performance. That is not a reporting limitation you can write around. Either get a lead quality feed back, even a weekly spreadsheet with a good or bad flag per lead, or state plainly in the methodology footer that conversions are unqualified form submissions.
Feeding qualified leads back into the platform is a tracking job rather than a reporting one, and the setup is in the Google Ads conversion tracking guide.
What changes for white label reporting?
If you deliver through another agency, the report has two audiences and only one of them is in the room. Three things change, and everything else in this article still applies.
- You report against the agreed scope, not against what you would have chosen. The partner committed to a KPI with their client. Your report is evidence against that commitment, whatever you think of it.
- The methodology footer has to be partner-branded and complete. They get asked the discrepancy question, not you, and they need those four lines ready to hand without calling you.
- Risks go out early and in writing. A partner cannot absorb a surprise. They need lead time to reframe it for their own client.
The full structure, including how partner access is set up and what belongs in the client-facing deliverable versus an internal note, is in white label PPC reporting: what should your clients see.
Which PPC reporting tools are worth paying for?
Short answer, because this is a smaller question than the category treats it as: the tool matters far less than the four things above.
What each tier of tool is actually for
| Tier | Examples of what it does | Use it when | It will not |
|---|---|---|---|
| Free connector, Data Studio | Pulls Google Ads, GA4 and Search Console directly, no cost | You manage a handful of accounts and want a live client dashboard | Pull Auction Insights. Blend paid platforms cleanly without work |
| Data pipeline | Moves platform data into Sheets, BigQuery or a warehouse on a schedule | You need blended cross-channel numbers or history beyond platform retention | Fix definition mismatches. It moves the disagreement, it does not resolve it |
| Agency reporting platform | White label, scheduled delivery, many connectors, templated client reports | You run more than roughly ten accounts and delivery time is the bottleneck | Write the insight. Every one of these ships a metrics grid by default |
| Spreadsheet | Manual export, your own structure | Fewer than five accounts, or any account where the reporting logic is unusual | Scale past about five accounts without eating your week |
One thing to check before buying anything: does the connector pull from the Google Ads API or scrape the interface? That single question determines whether you can get asset group level Performance Max channel data, and no vendor page states it plainly.
And a naming note that will date every document you write this year. The product is Data Studio. Google renamed Looker Studio back to Data Studio in April 2026: “reintroducing a beloved and familiar name, Data Studio (formerly Looker Studio)” (Google Cloud Blog, 10 April 2026), with the release notes rebrand following on 16 April 2026. The help documentation has moved domain too, so any page still linking to the old help URLs is pointing at redirects.
The PPC report template
Every template in this category is either a dashboard you copy or a metrics grid you fill in. Neither one answers the question a client is actually asking, so ours is a written structure rather than a chart gallery.
PPC report structure, page by page
| Page | Section | Content |
|---|---|---|
| 1 | Headline | One number against the goal, with the variance and the direction |
| 1 | What changed | Three to five items, each with a cause and a date |
| 1 | Actions taken | Dated, past tense |
| 1 | Decisions needed | With a deadline and an owner |
| 2 | Performance detail | Spend, conversions, CPA or ROAS, trended against target, by campaign |
| 2 | Channel and campaign mix | Including the Performance Max channel split |
| 3 | Diagnostics | Impression share lost to rank vs budget, search term shifts, asset performance, landing page metrics |
| 3 | Competitive | Auction Insights, manually exported, with the export date |
| 4 | Methodology footer | Pull date and time, account time zone, attribution model, which conversion actions are primary, click-time or conversion-time basis, known discrepancies and their stable baseline |
| 4 | Change log | Every account change in the period, dated |
Pages one and four are the two that nobody ships and the two that decide whether the report survives scrutiny. If you only add one thing to your current template, add the methodology footer.
Common PPC reporting mistakes
- Sending the same report to every audience. A CFO and a paid search manager need different documents.
- Reporting an account-average Quality Score. Google states it is a diagnostic and is not an auction input.
- Shipping an Average Position widget. The metric was sunset in September 2019. Four of the pages we reviewed still list it.
- Reporting ROAS as a bare number. Report 5.0 or 500%, never 500.
- Promising an automated competitor dashboard. Auction Insights fields left the connector in 2024 and the API allowlist is closed.
- Treating a PDF as final. It is a snapshot of a number that is still moving.
- Explaining a bad month with a metric that improved.
- Leaving out the methodology footer, which is what makes every one of the above arguable later.
Frequently asked questions
Does a click get attributed to the day of the click or the day of the conversion?
The day of the click, in the primary conversion columns. Google’s wording: “if your ad was clicked on last week and that traffic converted this week, both the click and the conversion are reported back to last week.” Conversions can be reported up to 90 days after the click, which is why recent periods look worse than they will end up.
Why is there a 30 percent conversion discrepancy between Google Ads and my store?
Four structural causes, usually together: click-date versus event-date reporting, modelled conversions in Google Ads that the store cannot see, different attribution scope, and a time zone mismatch. A stable gap is normal. A gap that changes suddenly is a signal worth investigating.
Are Google Ads conversions real or estimated?
Both. Google states that the Conversions column reports both modelled and observed conversions, and that low-volume accounts receive no modelled conversions at all because there is not enough data to model confidently.
Can I pull Auction Insights into a dashboard?
No. The twelve Auction Insights fields were removed from the connector for new data sources on 24 August 2024 and for existing sources on 23 September 2024. The Google Ads API metrics sit behind an allowlist that Google staff have confirmed is closed, with no timeline. Competitive share reporting is a manual monthly export.
Is search impression share the same as Auction Insights impression share?
No, and this is the most consequential confusion in PPC reporting. Search impression share is still available in the connector. The Auction Insights share metrics, including Outranking Share, Overlap Rate and Position Above Rate, are not.
What happened to Looker Studio?
Google renamed it back to Data Studio in April 2026. The announcement was on 10 April 2026 and the release notes rebrand on 16 April 2026. The help documentation has also moved to a new domain.
How often should PPC reports be sent to clients?
Monthly for the full report, with a live dashboard running continuously and a three to six line weekly note for accounts above roughly $10k a month or inside their first 90 days. Anything urgent goes out immediately rather than waiting for the scheduled report.
Should my agency give me access to my own Google Ads account?
Yes. You should hold admin on the Google Ads account, the Merchant Center account, the GA4 property and the conversion tracking. The agency should be granted access to accounts you own. If the numbers you see differ from the report, the explanation is the methodology footer, not a reason to withhold access.
Why does my report change after I send it?
Conversions are backdated to the click date as they arrive, for up to 90 days. Snapshot every report at the moment you send it and stamp the pull date, or you will eventually be asked to explain a change you did not make.
What does the AI Max upgrade mean for reporting?
Search campaigns using Campaign-level Broad Match or standalone Automatically Created Assets began auto-upgrading on 1 September 2026, with Dynamic Search Ads following in February 2027. Any reporting period straddling an upgrade contains two campaign types under one name, and keyword-level reporting becomes a weaker explanation of performance than the search terms report.
How we checked this
We read twenty-four pages currently ranking across ten PPC reporting queries in full, not their meta descriptions, and recorded what each one covers and omits. We counted product-name usage on every page that names the reporting tool. Every date and quotation in this article was verified against a primary source: Google Ads Help, Google Cloud and Data Studio release notes, the Google Ads Developer Blog, and the public adwords-api developer group for the Auction Insights allowlist. Where we could not confirm a detail from a primary source, we have said so in the text rather than repeating it. Community questions were sourced from the Google Ads Community forum, the Shopify Community and public Q and A threads, and are quoted as the questions people are actually asking rather than invented for the article.
Dates and product behaviour stated here are accurate as of September 2026. Google changes reporting surfaces frequently, so check the linked primary sources before quoting a date in a client document.
Want your reporting checked?
If your reports are getting questioned, the cause is usually one of four things: no methodology footer, no change log, a click-date effect nobody explained, or a competitive dashboard that was never going to work. We will review your current report and your account against this structure and tell you which of them applies.
Get your PPC reporting reviewed, or start with the 120-point Google Ads audit checklist if the account itself is the question.
If the reporting is the part that keeps slipping, our PPC management service includes the dashboard and the monthly read out, and our PPC agency page explains how we report spend, leads and cost per lead against a fixed baseline.
Summarise this article with: