LCP Core Web Vitals: What It Is, Why It Matters, and How to Fix It (2026)

Ishant
Published : November 3, 2026 at 6:04 am
Updated : November 3, 2026 at 7:10 pm
Ishant

Summarize this article with:
By Ishant Sharma Category: Technical SEO Published: November 2026 Reading time: 20 min
LCP, or Largest Contentful Paint, is a Core Web Vitals metric that measures how quickly the largest visible content element in the initial viewport renders. In practical terms, LCP answers one question:
How quickly does the main content of the page become visible to the visitor?
LCP is one of Google’s three current Core Web Vitals, alongside INP (Interaction to Next Paint) and CLS (Cumulative Layout Shift). It is a confirmed ranking signal.
However, a good LCP score does not guarantee higher rankings. Core Web Vitals are one part of Google’s broader page-experience and ranking system. Content quality, relevance, authority, and search intent remain the primary ranking factors.
What LCP does guarantee is a better user experience. Pages that load their primary content quickly retain more visitors, convert at higher rates, and give search engines more confidence in recommending them.
This guide covers what LCP is, how it is measured, what causes it to fail, and how to fix it on every major platform.
Key Observations
LCP (Largest Contentful Paint) measures how fast the largest content element in the viewport renders. Google rates scores at the 75th percentile: 2.5s or under is Good, 2.5 to 4s is Needs Improvement, and above 4s is Poor. The biggest fixes: cut server response time, load the LCP resource early, and compress images.
What Are Core Web Vitals?
Core Web Vitals are Google’s user-focused metrics for measuring important aspects of website experience. A technically strong website should monitor all three rather than optimizing LCP in isolation. The third metric, INP, replaced First Input Delay as the official responsiveness metric in 2024.
| Metric | What It Measures | Good Threshold |
|---|---|---|
| LCP: Largest Contentful Paint | Loading performance: how fast the main content renders | Under 2.5 seconds |
| INP: Interaction to Next Paint | Responsiveness: how fast the page reacts to user input | Under 200ms |
| CLS: Cumulative Layout Shift | Visual stability: how much the layout shifts unexpectedly | Under 0.1 |
For a broader technical SEO strategy, see our guide to advanced SEO techniques. It covers Core Web Vitals alongside indexation, structured data, and content depth.
Interaction to Next Paint (INP): The Metric That Replaced FID
What is an LCP score worth if the page still feels unresponsive to clicks? Not much on its own. Readers who already searched “what is Largest Contentful Paint” often assume Core Web Vitals stops there. It does not.
Interaction to Next Paint officially became the second Core Web Vital on March 12, 2024, replacing First Input Delay. FID only measured the delay before the browser started processing an input.
INP measures the full time from any interaction, a click, tap, or key press, to the moment the browser visually updates the page. That makes it a more complete responsiveness metric than FID ever was.
| Metric | Good | Needs Improvement | Poor |
|---|---|---|---|
| INP | 200ms or less | 200ms to 500ms | Above 500ms |
| FID (retired) | 100ms or less | 100ms to 300ms | Above 300ms |
Heading into 2026, a large share of websites still fail the 200ms INP threshold. Even so, more sites fail LCP than any other Core Web Vital: the 2025 Web Almanac puts good LCP at 62 percent of mobile sites, against 77 percent for INP and 81 percent for CLS.
Common INP problems include heavy JavaScript event handlers, large state updates in frameworks like React, and long tasks that block the main thread right when a user clicks something.
LCP vs FCP: What’s the Difference
LCP FCP CLS: three names, three different jobs. Confusion between them is common, but each metric measures something different. Only LCP and CLS remain official Core Web Vitals today.
What Is FCP?
What is First Contentful Paint, formally? It is the moment any content, text, a color change, or an image, first appears on screen. FCP is a diagnostic metric, not a Core Web Vital itself.
Largest Contentful Paint marks a later moment: when the main, largest piece of content becomes visible. LCP can never fire before FCP, so a slow FCP always means a slow LCP. A fast FCP does not guarantee a fast LCP.
| FCP | LCP | |
|---|---|---|
| Measures | First pixel painted | Largest element rendered |
| Core Web Vital? | No, diagnostic only | Yes |
| Good threshold | 1.8 seconds or less | 2.5 seconds or less |
| Typical trigger | Any visible content, even a spinner | Hero image, headline, or large text block |
How to Improve First Contentful Paint
Knowing how to fix First Contentful Paint starts with the same two levers as LCP: server response time and render-blocking CSS.
WordPress owners who ask how to improve First Contentful Paint on WordPress usually find render-blocking CSS from page builders is the cause. Reducing that CSS improves FCP first, and LCP soon after.
LCP Score Thresholds: What Google Expects
Good
≤ 2.5s
Target for all pages. Eligible for page experience benefit.
Needs Improvement
2.5 – 4s
Risk zone. May lose to competing pages with Good scores.
Poor
Above 4s
Significant performance and user experience problem.
These thresholds are evaluated using real user data at the 75th percentile. That means 75 percent of your actual visitors need to be experiencing LCP at or below the threshold for the page to qualify as Good.
Lab scores from PageSpeed Insights or Lighthouse are useful for debugging. But they do not directly determine your ranking status. Field data from CrUX does.
Important: The SEO Objective Is Not a Green ScoreThe objective of LCP optimization is not to achieve a particular number in a lab tool. The objective is to make the primary content appear quickly and consistently for real visitors. This should hold across the full range of devices, connections, and locations that your audience uses. Lab scores are debugging tools, not the goal itself.
What Is the LCP Element?
The LCP element is the largest qualifying content element visible in the initial viewport during page loading. Element types that can qualify include:
<img>elements<image>elements inside SVG- Video poster images (
<video poster>) - Video content in supported circumstances
- CSS background images loaded via
url() - Large blocks of text in block-level elements
On real websites, the LCP element is most often a hero image, product image, or promotional banner. It can also be a featured image or an above-the-fold heading on text-heavy pages.
Your first optimization step should always be to find the actual LCP element before changing any code. Fixing the wrong element wastes effort.
How to Find Your LCP Element
Method 1: PageSpeed Insights
Open PageSpeed Insights and enter the URL you want to test. Review the diagnostics section. It identifies the specific LCP element, the time spent in each contributing phase, and the improvement opportunities most likely to reduce your LCP.
Method 2: Chrome DevTools
Open Chrome DevTools, go to the Performance panel, click Record, and reload the page. The LCP marker in the timeline shows exactly when the LCP element rendered and what the browser was doing in the moments before it.
This gives a more detailed picture than PageSpeed Insights alone.
Method 3: Google Search Console
Search Console’s Core Web Vitals report shows real-user field data grouped by URL status (Good, Needs Improvement, Poor). Use Search Console to identify which pages or page groups are failing at scale, then use PageSpeed Insights and DevTools to diagnose specific URLs.
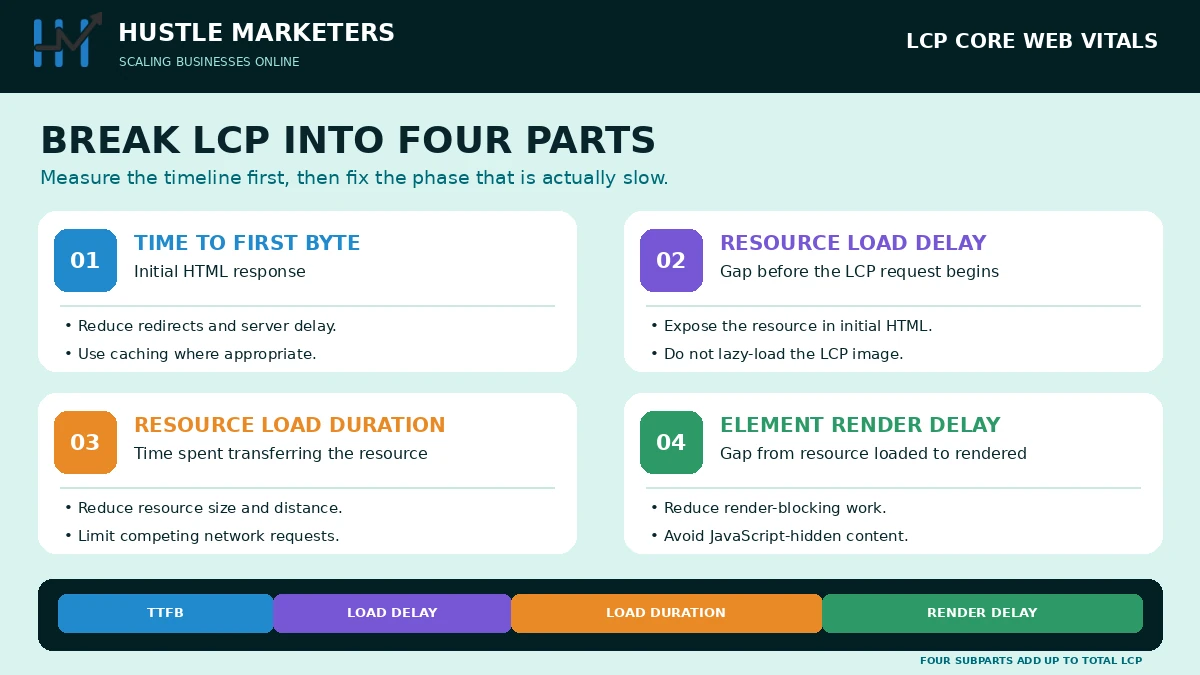
The Four Sub-Parts of LCP
A key diagnostic principle: LCP is the sum of four contributing phases. If your LCP is 5 seconds, you need to know where those five seconds are being spent before you can fix them efficiently.
A framework used by Google’s own performance team breaks LCP into:
Phase 1
Time to First Byte (TTFB)
Time from navigation start to receiving the first byte of the HTML document. A slow TTFB delays every downstream phase. Causes include slow hosting, no page caching, slow database queries, and unnecessary redirects.
Phase 2
Resource Load Delay
Time between the browser receiving the document and beginning to download the LCP resource. Long delays mean the critical resource was discovered late, often blocked by CSS, JavaScript, or a late position in the HTML.
Phase 3
Resource Load Duration
Time spent downloading the LCP resource. A large, unoptimized image on a slow connection creates a long load duration. Compress images and serve the right size for each device.
Phase 4
Element Render Delay
Time between the resource finishing its download and it painting on screen. Long delays here mean the main thread is blocked by JavaScript. Even after the image has downloaded, the browser cannot paint it.1. TTFB2. Load Delay3. Load Duration4. Render DelayServerDiscoveryDownloadPaintNavigation start to LCP renderLCP is the sum of four phases: TTFB, resource load delay, resource load duration, and element render delay.
LCP Waterfall: Poor vs Good Page (Illustrative)
POOR PAGE: LCP ~5.8 seconds
TTFB
1,800ms
Resource Load Delay
1,200ms
Resource Load Duration
1,500ms
Element Render Delay
1,300ms
GOOD PAGE: LCP ~1.9 seconds
TTFB
420ms
Resource Load Delay
150ms (preloaded)
Resource Load Duration
540ms (WebP compressed)
Element Render Delay
210ms (main thread clear)
What Causes Poor LCP? Root Cause Table
| Root Cause | LCP Phase Affected | Typical Solution |
|---|---|---|
| Slow server or missing page cache | TTFB | Server/page caching, better hosting, CDN |
| Slow database queries or server processing | TTFB | Database optimization, object caching |
| Unnecessary redirect chains | TTFB | Eliminate redirect chains, direct URLs |
| LCP image discovered late (through JS or CSS) | Resource Load Delay | Preload hint, move to <img> tag |
LCP image has loading="lazy" | Resource Load Delay | Remove lazy loading from above-fold LCP image |
| Render-blocking CSS or JS above the LCP resource | Resource Load Delay | Defer non-critical CSS/JS |
| Large uncompressed image | Resource Load Duration | Compress, right-size, serve modern format |
| Image in JPEG/PNG instead of WebP/AVIF | Resource Load Duration | Convert to WebP or AVIF |
| No CDN for static assets | Resource Load Duration | CDN for images, CSS, JS, fonts |
| Heavy third-party scripts blocking main thread | Element Render Delay | Defer, delay, or remove non-critical scripts |
| Long JavaScript tasks at load | Element Render Delay | Reduce JS bundle size, defer JS |
| Client-side rendering of LCP element | Multiple phases | Server-side rendering or static generation |
How to Fix LCP: Step-by-Step
Fix 1
Fix Server Response Time First (TTFB)
If your TTFB is high, fix it before spending significant time on frontend optimization. A slow server delays every other phase. No amount of image compression or preloading can overcome a server that takes 2 seconds to respond, a point Google’s LCP guidance makes directly.
- Enable full-page caching: serve cached HTML instead of generating a new response for every request
- Enable object caching (Redis or Memcached) where appropriate
- Upgrade hosting if the server is fundamentally underpowered for your traffic
- Set up a CDN to serve pages from a location closer to the visitor
- Optimize database queries and reduce server-side processing time
- Eliminate needless redirect chains. Each redirect adds a full round-trip
Fix 2
Make the LCP Resource Discoverable Early
If your LCP element is an image, the browser needs to find it as early as possible. The default HTML parsing sequence can delay image discovery significantly, especially when images load through JavaScript or deeply nested CSS.
A <link rel="preload"> tag instructs the browser to start fetching the image immediately, before it would normally find it.
<link
  rel="preload"
  as="image"
  href="/images/hero.webp"
  fetchpriority="high"
  imagesrcset="/images/hero-sm.webp 600w, /images/hero-md.webp 1200w"
  imagesizes="100vw">
Important: Do not preload every image. Preloading too many resources creates bandwidth competition. Use it for the resource that is really your LCP bottleneck, and confirm with testing that early discovery is actually the issue.
Fix 3
Use fetchpriority=”high” on the LCP Image
The fetchpriority="high" attribute signals to the browser that this image is more important than others and should be fetched with higher priority. Add it directly to the LCP <img> tag:
<img
  src="/images/hero.webp"
  width="1200"
  height="600"
  fetchpriority="high"
  alt="Hero image">
Do not mark multiple non-critical images as high priority. The goal is to prioritize the one resource that matters for LCP.
Fix 4
Never Lazy-Load the LCP Image
Lazy loading is useful and recommended for images that are below the fold. But the LCP image is always above the fold by definition. Applying lazy loading to it instructs the browser to delay fetching it, which directly increases LCP.
This is one of the most common causes of LCP failure on WordPress sites, where lazy loading has been applied globally.
Avoid this on any above-fold LCP image:
<!-- WRONG for LCP image -->
<img src="hero.webp" loading="lazy">

<!-- CORRECT for LCP image -->
<img src="hero.webp" fetchpriority="high">
Fix 5
Serve the Correct Image Size With Responsive Images
Serving a 3,000px image when the display container needs only 800px wastes bandwidth and increases Resource Load Duration. Every device should receive an image appropriately sized for its display. Use srcset and sizes:
<img
  src="hero-800.webp"
  srcset="hero-400.webp 400w, hero-800.webp 800w, hero-1200.webp 1200w"
  sizes="(max-width: 600px) 100vw, (max-width: 1200px) 80vw, 1200px"
  width="1200"
  height="600"
  fetchpriority="high"
  alt="Hero image">
Also set explicit width and height attributes. This lets the browser reserve space before the image loads, which prevents layout shift (CLS).
Fix 6
Serve Images in Modern Formats (WebP or AVIF)
WebP provides about 25 to 35 percent smaller files than JPEG at comparable quality. AVIF can achieve 40 to 50 percent reductions. Smaller files mean faster Resource Load Duration.
Use the <picture> element to serve modern formats with a fallback for older browsers:
<picture>
  <source srcset="hero.avif" type="image/avif">
  <source srcset="hero.webp" type="image/webp">
  <img src="hero.jpg" alt="Hero image" width="1200" height="600"
       fetchpriority="high">
</picture>
Use the smallest file that gives acceptable visual quality for the actual display size. There is no universal size target like “under 200 KB” that fits every image. The right size depends on image dimensions, complexity, quality needs, and your audience’s network conditions.
Fix 7
Reduce Render-Blocking CSS and JavaScript
CSS and JavaScript files that the browser must download and process before displaying any content can delay LCP significantly. Every render-blocking millisecond delays when the LCP element can paint.
- CSS: Inline critical above-the-fold styles directly in the
<head>. Load non-critical CSS asynchronously. Remove unused CSS using tools like PurgeCSS - JavaScript: Add
deferorasyncto non-critical scripts. Move scripts that do not need to run before render to the end of the body - Google Fonts: Use
display=swapand preconnect to fonts.googleapis.com and fonts.gstatic.com. Preload only truly critical font files
Fix 8
Audit and Defer Third-Party Scripts
Third-party scripts (analytics, tag managers, chat widgets, ad pixels, heatmaps, social buttons, review platforms) compete for main thread time. They can stop the browser from rendering the LCP element even after the image has finished downloading.
- Audit every tag in Google Tag Manager. Remove unused tags completely
- Ask for each script: does this need to execute before the primary content is visible?
- Delay non-essential scripts (chat, social, retargeting pixels) until after the initial page load using
setTimeoutor an Intersection Observer approach - Use WebPageTest’s waterfall view to identify which third-party scripts are executing earliest and consuming the most main-thread time
- Do not remove essential analytics or advertising functionality just to improve a lab score. Find the least disruptive loading strategy
Fix 9
Use a CDN for Images and Static Assets
A Content Delivery Network serves static assets from servers geographically close to the visitor, reducing round-trip network time. CDNs matter most for sites with international visitors, where a single-origin server creates long round-trips.
A CDN is not a substitute for fixing a slow origin server. But it is a high-impact addition once TTFB at origin is under control.
Fix 10
Eliminate Needless Redirect Chains
Each redirect in a chain adds a full network round-trip before the browser can begin loading the actual page. Review your homepage, canonical URLs, HTTP-to-HTTPS redirects, www/non-www handling, and any legacy URL structures.
A URL that goes through two or three redirects before reaching the final page adds real cost. It can easily add 500ms or more to TTFB before a single byte of real content arrives.
The fetchpriority Attribute and Resource Hints Explained
The fix cards above already answer how to improve Largest Contentful Paint step by step. This section goes deeper on one part of that process: choosing the right resource hint.
Largest Contentful Paint: How to Improve It With Resource Hints
Three tools compete for the same goal: getting a critical resource to the browser sooner. They are not interchangeable.
| Hint | What It Does | Use For |
|---|---|---|
fetchpriority="high" | Raises priority of a resource already in the HTML | The LCP <img> tag itself |
rel="preload" | Tells the browser to fetch a resource before it would normally discover it | LCP images loaded late via CSS or JS |
rel="preconnect" | Opens a connection to a third-party origin early | CDN, font, or API domains used by the LCP resource |
<link rel="preconnect" href="https://cdn.example.com">
<link rel="preload" as="image" href="/hero.webp" fetchpriority="high">
Improve Largest Contentful Paint by applying fetchpriority to exactly one element: the true LCP resource. Marking several images as high priority cancels the benefit, since the browser can no longer tell which one matters most.
Many ask how to improve LCP once server response time is already fast. Resource hints are usually the next lever, ahead of further image compression.
Teams that ask how to improve Largest Contentful Paint on WordPress often find the real culprit is a plugin, not a missing attribute. A caching or lazy-load plugin can silently re-add loading="lazy" after every update, undoing a fetchpriority fix.
LCP by Platform
WordPress
WordPress sites have five major LCP levers:
- Hosting: Shared hosting is the most common cause of TTFB above 1 second. Managed hosting with server-level caching (Kinsta, WP Engine, Cloudways) delivers significantly lower TTFB
- Caching: Use page caching (WP Rocket, W3 Total Cache, or server-native caching). Serve cached HTML for every request rather than regenerating from PHP and database each time
- Images: Use an image optimization plugin (Imagify, ShortPixel, Smush) to auto-convert uploads to WebP and compress them. Exclude the LCP image from lazy loading in the plugin settings
- Plugins: Each active plugin adds PHP execution time and may inject CSS or JavaScript. Audit and deactivate anything not providing active value
- Theme: Heavy page builder themes inject large CSS and JavaScript payloads. Lightweight themes (GeneratePress, Astra, Blocksy) reduce this overhead significantly
Shopify
Shopify manages infrastructure, hosting, and CDN delivery. But theme and app code can still create significant LCP problems.
- Audit hero images in the theme. Confirm they use Shopify’s CDN with correct dimensions and WebP format (Shopify auto-converts to WebP when using the
image_urlfilter) - Use
loading: 'eager'andfetchpriority: 'high'in the theme liquid template for hero section images - A common ecommerce mistake is allowing many apps to inject scripts and stylesheets into every page. If an app is not delivering meaningful business value, evaluate whether its frontend code needs to remain active
- Audit theme JavaScript and remove sections or scripts that are not in use
WooCommerce
WooCommerce inherits WordPress performance considerations while adding ecommerce complexity. Pay particular attention to product image sizes. WooCommerce stores often serve 2,000px product images in 300px containers.
Configure image size settings correctly in WooCommerce settings and regenerate thumbnails after changes. Apply the WordPress recommendations above, with extra attention to above-the-fold product media on category and product pages.
Next.js and React
JavaScript frameworks can introduce LCP problems when important content renders client-side after a JavaScript bundle has loaded and executed. Consider server-side rendering (SSR) or static generation for pages with high LCP requirements. Use Next.js’s built-in <Image> component with priority={true} for the above-fold hero.
This automatically adds the preload and fetchpriority hints. Reduce client-side JavaScript bundle size and avoid needless hydration for content that does not require interactivity.
Common LCP Edge Cases: SPAs, Iframes and Progressive JPEGs
Three technical edge cases trip up even experienced teams. Each one makes LCP behave in a way that looks like a bug but is actually documented behavior.
Single-Page Apps and Soft Navigations
By default, a single-page app only reports LCP for its very first load, not later in-app navigation. Chrome 151 added support for tracking Core Web Vitals across these soft navigations.
Safari and Firefox do not yet support soft-navigation tracking. Field data for SPA-heavy sites currently reflects Chromium visitors only.
LCP Inside Iframes
A largest contentful paint element inside an iframe behaves differently from one in the main document. Lab tools like Lighthouse only report LCP for the main page frame by default.
Real-world Chrome UX Report data does account for iframe content, such as an embedded video’s poster image. That difference can create a mismatch between a lab score and real field data.
Progressive JPEGs
Progressive JPEGs are not larger than a regular JPEG of the same quality, but they can mislead a visual check. They display a blurry, low-quality version quickly, making the page look loaded already.
That preview can differ from what the Largest Contentful Paint metric records, so read the LCP time in PageSpeed Insights or the DevTools Performance panel rather than judging it by eye.
Field Data vs Lab Data: Why This Distinction Matters for SEO
Lab Data (Lighthouse / PageSpeed)
- Controlled testing environment
- Single location, simulated device and connection
- Consistent, useful for debugging changes
- Does not reflect real user variation in device, network, geography, or hardware
- Use for: diagnosing and testing fixes
Field Data (CrUX / Search Console)
- Real user measurements from Chrome browsers
- Captures full range of devices, connections, and locations
- Rolling 28-day window, so changes take time to show
- This is what Google uses to assess Core Web Vitals for ranking
- Use for: understanding real-world performance and ranking impact
A page can score 90+ in Lighthouse and still show Poor field data in the real world. This happens when real users are primarily on slow mobile connections, in distant locations, or hitting uncached server responses.
Never assume that improving a Lighthouse score automatically means real-user LCP improved. Always verify with field data before reporting improvements to clients.
Real LCP Benchmark Data: What the Numbers Actually Show
Numbers help more than a pass or fail line. The HTTP Archive’s Web Almanac tracks LCP across millions of real websites every year.
| Metric | Figure | Source |
|---|---|---|
| Mobile pages with a good LCP | Roughly 62% (2025) | HTTP Archive Web Almanac |
| Mobile LCP elements that are images | Roughly 76% (2025) | HTTP Archive Web Almanac |
| Mobile sites lazy-loading their own LCP image | Roughly 16% | HTTP Archive Web Almanac |
Mobile LCP still lags well behind desktop. Slower processors, slower connections, and heavier third-party scripts all stack up on mobile devices in ways desktop testing hides.
The lazy-loading figure is the one worth remembering. An estimated one in six mobile sites still lazy-loads the exact image that should load first. That mistake remains one of the most common, most fixable LCP failures on the web today.
Use these figures as a benchmark, not a target. A site sitting below the roughly 62 percent pass mark is behind the average, not automatically failing its business goals.
What Performance Practitioners and Google Engineers Say About LCP
Performance practitioners, Google’s developer documentation, and YouTube deep-dives from performance engineers in 2025 and 2026 point to four consistent findings. One notable source is a NitroPack webinar featuring Google’s Barry Pollard and Adam Silverstein, which walks through the four-phase LCP diagnostic framework.
Practitioner Insight 1: Diagnose Which Phase Is Slow Before Touching AnythingThe clearest and most repeated lesson from performance practitioners is this: do not optimize LCP by guessing which element is slow. Identify the actual LCP element. Then determine which of the four phases (TTFB, resource discovery, resource download, or element render) is consuming the most time. The fix for a 3-second TTFB is completely different from the fix for a 3-second Resource Load Delay caused by late image discovery. Applying image compression to a TTFB problem wastes time and produces little improvement. This diagnostic approach, consistently emphasized by Google’s own performance team, is the single most important shift in how practitioners now approach LCP work.
Practitioner Insight 2: TTFB Is the Most Underinvestigated LCP CausePractitioners who have audited LCP across many sites consistently report that server response time is the dominant factor and the most commonly ignored one. Most site owners open PageSpeed Insights, see a large hero image, compress it, and wonder why LCP improved by only 200ms. The answer is usually a server adding 1.5 to 2 seconds before the browser could start anything. Managed hosting with server-level page caching often delivers more LCP improvement than all image work combined. Fix TTFB first. Then compress images. Then add the preload hint, not the reverse.
Practitioner Insight 3: The Preload Hint Is One of the Highest-Impact Single-Line ChangesWhen the hero image is a CSS background or is added by JavaScript, the browser cannot find it until that CSS or script has loaded. A preload link tag, or fetchpriority=”high” on an img element, moves image discovery to the start of the HTML parse and shrinks Resource Load Delay, one of the four LCP phases. On a page where TTFB and image size are already reasonable, that one change can be enough to move LCP from Needs Improvement to Good. Measure it: compare the Resource Load Delay phase in PageSpeed Insights before and after you add the tag.
Practitioner Insight 4: loading=”lazy” on the LCP Image Is More Common Than It Should BeIn practitioner audits, one of the most frequently discovered LCP failures is loading="lazy" applied to the hero image. This is often added by a WordPress theme, a global plugin setting, or a developer who applied it across all images without excluding the hero. The impact is direct and severe: the browser intentionally delays fetching the resource. Practitioners working through WordPress LCP audits report finding this mistake in roughly one in four sites. Always clearly exclude the LCP image from any lazy load setup, and verify with DevTools that fetchpriority="high" is present on the correct element.
Field Data Timeline BenchmarkAfter making LCP fixes, lab scores update immediately. Field data in Google Search Console takes longer because CrUX uses a rolling 28-day window of real user visits. Allow at least 28 days after deployment before evaluating the ranking impact of Core Web Vitals improvements. Monitor field data continuously rather than checking a single Lighthouse score and declaring success.
LCP Case Studies: What Real Fixes Are Worth
Largest Contentful Paint: how to improve it in ways that show up in real business numbers, not just a lab score? Two documented case studies answer that directly.
Case Study 1: Vodafone, 31% Faster LCPVodafone reduced LCP by 31 percent across a set of pages and measured an 8 percent increase in sales in an A/B test against the original pages. The improvement came from standard fixes: image optimization, faster server response, and a better resource loading order, not one single trick.
Case Study 2: Google Flights, 700ms From One AttributeGoogle’s own team reported cutting LCP by roughly 700 milliseconds on Google Flights after adding a single fetchpriority="high" attribute to the LCP image. No other change was needed to see that result.
Both cases share a pattern. Neither started with a complete rebuild. Both started with measuring the actual bottleneck, then applying a targeted, well-understood fix.
For client-facing SEO work, these two numbers matter more than any Lighthouse score. A sales increase and a fully documented 700ms fix are the kind of evidence that justifies performance work to a skeptical stakeholder.
LCP and SEO Rankings: The Honest Picture
Google confirmed Core Web Vitals as ranking signals with the Page Experience Update. However, it is important to be accurate about what this means in practice.
Improving LCP can strengthen page experience and remove a technical disadvantage. It does not guarantee ranking improvement. Google’s page-experience documentation makes clear that page experience is one component of a larger ranking system.
A technically fast page with weak content, poor relevance, or low authority will still lose to a slower page that better satisfies search intent.
The correct SEO goal is:
Build the most useful, authoritative page for the target query. Then remove needless technical performance barriers so nothing slows down the experience of reaching that content.
The indirect benefits of good LCP are often more consistently observable than the direct ranking benefit. Pages that load quickly have lower bounce rates and higher engagement. They also convert better and let Googlebot crawl more pages within a given crawl budget window.
LCP and AEO: Can Page Speed Help AI Search Visibility?
A question that comes up increasingly in 2026 is whether LCP scores affect visibility in AI-powered search engines like Perplexity, ChatGPT Search, and Gemini. The honest answer is: there is no reliable evidence that AI systems cite pages based on their LCP score.
What does support AI visibility is content that is clearly structured and directly responsive to questions. It should be factually accurate, easy to crawl and parse, supported by relevant internal links, and written with genuine expertise.
Technical performance supports overall page quality, but content usefulness and authority are what AI systems evaluate when selecting sources to cite.
Do not treat LCP optimization as an AEO strategy. Treat it as a component of building a technically clean, fast, and accessible website.
Common LCP Optimization Mistakes to Avoid
Mistake 1
Chasing a Lighthouse Score
A high lab score does not automatically mean excellent real-user performance. Monitor field data in Search Console instead, since that is what Google uses.
Mistake 2
Compressing Images First
The bottleneck may be TTFB, resource discovery delay, or JavaScript. Identify the failing phase before choosing a fix.
Mistake 3
Preloading Too Many Resources
Excessive preloads compete for bandwidth. Use preloading only for the genuinely critical LCP resource when testing confirms late discovery is the issue.
Mistake 4
Lazy-Loading the LCP Image
This is one of the most common and impactful LCP mistakes. The browser intentionally delays fetching the resource, adding hundreds to thousands of milliseconds.
Mistake 5
Removing All JavaScript
The goal is not zero JavaScript. It is avoiding unnecessary execution on the critical rendering path. Keep what is needed, defer what is not.
Mistake 6
Using Arbitrary File Size Targets
Rules like “every image must be under 200 KB” ignore image dimensions, complexity, quality requirements, and user expectations. Optimize based on actual page and audience data.
Tools to Measure LCP
Field Data
Google Search Console
Core Web Vitals report shows real-user data from CrUX across groups of URLs. Use this first to understand scale and which page groups are failing.
Lab + Field
PageSpeed Insights
Provides both Lighthouse lab diagnostics and CrUX field data per URL. Identifies the LCP element, sub-phase breakdown, and improvement opportunities. Start here for per-page diagnosis.
Lab Data
Chrome DevTools
Performance panel shows full waterfall with LCP marker, long tasks, and third-party script timings. Best tool for detailed debugging of specific LCP issues.
Lab Data
WebPageTest
Advanced waterfall, filmstrip screenshots, third-party breakdown, and network throttling. Essential for diagnosing CDN caching, redirect chains, and third-party script impact.
Field Data
Chrome UX Report (CrUX)
The actual dataset Google uses for ranking assessments. Queryable via BigQuery or the CrUX API. Shows 75th-percentile LCP at domain, URL, and country level.
Real User Monitoring
Cloudflare Browser Insights
Available on Cloudflare Pro and above. Real LCP, FCP, and CLS from actual visitors segmented by country, device, and browser. Useful for ongoing post-fix monitoring.
Benchmarking Your LCP Against Competitors and Your Industry
A raw LCP number means little without context. Is 2.8 seconds bad? It depends entirely on what similar sites in your space are already achieving.
PageSpeed Insights and the CrUX dashboard both support checking any public URL, not only your own. Run your top three competitors through the same tool you use for your own site.
- Test the same page type on each site: homepage to homepage, product page to product page
- Record LCP, INP, and CLS for mobile and desktop separately
- Note which competitors pass all three Core Web Vitals versus which ones fail at least one
- Repeat quarterly, since Core Web Vitals field data shifts as competitors ship changes
Tools like DebugBear and other real-user-monitoring platforms can automate this tracking and alert you when a competitor’s score changes meaningfully.
For client reporting, a competitor comparison table often lands better than an isolated score. “You beat two of your three main competitors on LCP” is more persuasive than “your LCP is 2.1 seconds.”
How to Measure LCP with the PerformanceObserver API
Lighthouse and PageSpeed Insights cover most needs, but developers sometimes want raw LCP data inside their own code. The PerformanceObserver API provides that directly, in the browser.
new PerformanceObserver((entryList) => {
  const entries = entryList.getEntries();
  const lastEntry = entries[entries.length - 1];
  console.log('LCP candidate:', lastEntry.startTime);
  console.log('Element:', lastEntry.element);
}).observe({ type: 'largest-contentful-paint', buffered: true });
This snippet logs every LCP candidate as the browser finds one, along with the actual DOM element responsible. The final entry before user input is the reported LCP value.
Real user monitoring setups often send this data to an analytics endpoint instead of the console. That captures real LCP values across an entire user base rather than one test session.
This approach works best for teams building a custom performance dashboard, or debugging a specific LCP issue that lab tools cannot reproduce reliably.
LCP Fix Priority Checklist
Measurement
- Check Search Console Core Web Vitals report for failing URL groups
- Test the specific page in PageSpeed Insights
- Identify the actual LCP element
- Identify which sub-phase (TTFB, Load Delay, Load Duration, Render Delay) is consuming the most time
- Test mobile and desktop separately
- Check all important page templates, not just the homepage
TTFB
- Check server response time: is it above 800ms?
- Verify page caching is active and serving cached responses
- Review hosting performance under realistic traffic
- Check for and eliminate unnecessary redirect chains
- Evaluate CDN configuration for static assets
- Review database and server-side processing time
LCP Resource
- Confirm the exact LCP element and resource
- Check: does the LCP image have
loading="lazy"? Remove it immediately - Add
fetchpriority="high"to the LCP<img>tag - Add a
<link rel="preload">hint when testing confirms late discovery is the issue - Serve the LCP image as WebP or AVIF
- Set up
srcsetandsizesfor responsive delivery - Set explicit
widthandheighton the LCP image element - Verify the LCP element is an
<img>tag, not a CSS background (preloading CSS backgrounds is harder)
Rendering
- Audit render-blocking CSS: inline critical styles, defer the rest
- Defer non-critical JavaScript with
deferorasync - Audit and delay third-party scripts that do not need to fire before first render
- Remove unused CSS
- Review font loading: use
font-display: swap
Validation
- Retest in PageSpeed Insights after each change
- Test with Chrome DevTools to confirm the preload and fetchpriority are working
- Test on real mobile devices, not only desktop Lighthouse
- Check that INP and CLS have not regressed
- Monitor field data in Search Console for 28 days after fixes
Frequently Asked Questions
What is LCP in Core Web Vitals?
LCP stands for Largest Contentful Paint. It measures when the largest qualifying content element visible in the initial viewport has rendered. It is one of Google’s three Core Web Vitals alongside INP and CLS.
What is a good LCP score?
A Good LCP is 2.5 seconds or less at the 75th percentile of real user data. Between 2.5 and 4 seconds is Needs Improvement. Above 4 seconds is Poor.
What causes poor LCP?
Common causes include slow server response time (TTFB), late resource discovery, and large or unoptimized images. Other factors are inefficient image formats, excessive JavaScript execution, third-party scripts, and no CDN.
How do I find my LCP element?
Use PageSpeed Insights or Chrome DevTools Performance panel. PageSpeed Insights highlights the specific element and reports which LCP sub-phase is consuming the most time.
Does LCP affect Google rankings?
Core Web Vitals including LCP are part of Google’s page-experience considerations and confirmed ranking signals. However, a good LCP score does not guarantee higher rankings. Content quality, relevance, authority, and search intent remain central to ranking outcomes.
Should I preload my LCP image?
A preload hint can help when the LCP resource would otherwise be discovered late by the browser. Use it selectively for genuinely critical resources when testing confirms that late resource discovery is the bottleneck. Do not preload every image on the page.
Should the LCP image use lazy loading?
No. Avoid adding loading="lazy" to a critical above-the-fold LCP image because doing so instructs the browser to delay its download, which directly increases LCP time. Use lazy loading only for genuinely below-the-fold content.
What is TTFB?
TTFB stands for Time to First Byte. It measures the time between a user’s request and when the first byte of the server response is received. A slow TTFB delays every downstream phase including the LCP element.
Is WebP better than AVIF?
Both can provide efficient image compression compared to JPEG and PNG. AVIF often achieves higher compression ratios. The best choice depends on the specific image, browser support requirements, quality settings, and your setup.
How do I improve LCP on WordPress?
Start by identifying the actual LCP element. Then investigate hosting and server response time, page caching, image delivery and compression, resource prioritization, JavaScript overhead, CSS payload, and third-party scripts. Managed hosting with server-level caching is often the highest-impact change for WordPress sites.
How do I improve LCP on Shopify?
Audit your theme hero images, app scripts, JavaScript, fonts, and third-party tracking scripts that affect the initial viewport. Shopify’s CDN handles image delivery automatically, but theme code and app scripts are common sources of LCP delays.
Can slow hosting cause poor LCP?
Yes. Slow server response time (TTFB) is one of the most common and impactful causes of poor LCP. Check the actual TTFB contribution in your LCP waterfall before deciding whether hosting is the primary issue.
Should I focus on LCP or INP?
Both matter and both are Core Web Vitals ranking signals. Fix whichever is failing based on your real-user field data in Google Search Console, and monitor all three metrics together.
What replaced First Input Delay as a Core Web Vital?
Interaction to Next Paint, or INP, replaced First Input Delay as the second Core Web Vital. Google made the change official on March 12, 2024.
INP measures the full time from a click or key press to the moment the browser visually updates the page. That gives a more complete picture of responsiveness than FID ever provided.
What is a good INP score?
A good INP score is 200 milliseconds or less, measured at the 75th percentile of a page’s interactions. Between 200 and 500 milliseconds needs improvement.
Anything above 500 milliseconds counts as poor. On mobile, more sites fail LCP than INP: the 2025 Web Almanac puts good INP at 77 percent of mobile sites and good LCP at 62 percent.
What is the difference between LCP and FCP?
First Contentful Paint marks the moment any content first appears on screen, even a loading spinner or a nav bar. Largest Contentful Paint marks when the main, largest piece of content becomes visible.
FCP is a diagnostic metric only. LCP is an official Core Web Vital that affects page experience signals.
What does the fetchpriority attribute do?
Adding fetchpriority="high" to your LCP image tells the browser to download that resource before other, lower-priority requests. In a documented Google Flights case study, this single attribute cut LCP by about 700 milliseconds.
Avoid adding it to multiple elements. Overuse cancels the benefit, since the browser can no longer tell which resource matters most.
Can my LCP score change after the page first loads?
Yes. If a larger element renders later, such as an image replacing a placeholder, the browser reports a new LCP candidate. This can keep happening as the page continues loading.
Once a user clicks or types anywhere on the page, LCP measurement stops. The last reported value becomes final.
Does LCP work the same way inside an iframe?
Not by default. Lab tools like Lighthouse only report LCP for the main page frame, not content inside an iframe.
Real-world Chrome UX Report data does account for iframe content, such as an embedded video’s poster image. This can create a mismatch between a lab score and real user data.
Are progressive JPEGs bad for LCP?
Progressive JPEGs are not larger than regular JPEGs of the same quality, but they can be misleading. They display a blurry, low-quality version quickly, making the page look loaded already.
The blurry preview can differ from what the Largest Contentful Paint metric records, so check the LCP time in PageSpeed Insights or DevTools rather than judging it by eye.
Does a single-page application track LCP correctly?
By default, single-page apps only report LCP for the very first page load, not later in-app navigation. Chrome 151 added support for tracking Core Web Vitals across these soft navigations.
Safari and Firefox do not yet support this feature, so this data currently covers Chromium visitors only.
What percentage of my Lighthouse score does LCP control?
Largest Contentful Paint makes up 25 percent of the overall Lighthouse Performance score. Only Total Blocking Time weighs more, at 30 percent, and CLS carries the same 25 percent as LCP.
This is why fixing LCP issues tends to produce the biggest visible jump in a Lighthouse score.
How much of the real web actually passes LCP today?
According to the HTTP Archive’s Web Almanac, roughly 62 percent of mobile sites achieved a good LCP score in its 2025 edition.
LCP has the lowest pass rate of the three Core Web Vitals on mobile, and about 76 percent of mobile LCP elements are images, which is why image discovery and delivery fixes matter so much.
Final Takeaway
LCP is not a single optimization. It is the result of a sequence:
Server response → Resource discovery → Resource download → Element rendering
If any part of that sequence is slow, LCP suffers. The most effective approach is always the same: measure first, then identify the actual failing phase. Fix the right thing, and verify with real user data rather than lab scores.
Do not chase a Lighthouse number. Do not apply fixes without knowing which phase is the bottleneck. Do not promise ranking improvements from one Core Web Vital improvement alone.
Instead, build a website that delivers its primary content quickly and works reliably for real users across all devices and connections. It should combine strong technical performance with genuinely useful content. That is the foundation of sustainable technical SEO.
About the Author
Ishant Sharma is the Founder and CEO of Hustle Marketers, a Google Partner and Meta Business Partner digital marketing agency based in Zirakpur, Punjab, India.
Working across technical SEO, Core Web Vitals, Google Ads, Meta Ads, and ecommerce growth, he helps businesses grow since 2013. He improves their organic rankings, site performance, and paid acquisition results.
He is a Top Rated Plus freelancer on Upwork with a 99 percent Job Success Score.
If LCP is the blocker on a site that also needs its rankings fixed, our SEO agency page explains how we handle technical fixes alongside content, and enterprise SEO covers larger sites where every fix has to go through a release cycle.