Infographics for SEO: How to Create, Optimize, and Build Links with Visual Content

Ishant
Published on November 6, 2026
Ishant

Summarize this article with:
By Ishant Sharma | Content & Link Building | Published November 2026 | 16 min read
Infographics became popular in the early 2010s as a link building tactic. The internet quickly flooded with weak visual content that nobody wanted to share. That era gave infographics a bad name they have never fully shaken.
But here is what most marketers miss. Well-made infographics based on original data still earn links at a rate few other content formats can match. The reason is simple.
Publishers want to give their readers visual content that is shareable and credible. A well-designed infographic presenting original research on a topic they cover is truly useful to them, and they will link to it.
This guide explains how infographics help SEO. It covers how to create one that earns links, how to optimize it for search, and how to distribute it well.
It also covers the mistakes that turned infographics from a link magnet into a format people now roll their eyes at.
What is an SEO infographic, really, if not a visual asset built to earn links and rank in image search? That is the standard every section below is built around.
Key Observations
Infographics help SEO through four mechanisms. They earn backlinks when other sites embed them, drive traffic from Google Images, increase time on page, and get shared on social media. But that only happens under certain conditions: the infographic needs original data, a keyword-optimized page with real text content, and promotion through direct outreach.
How Infographics Help SEO
Infographics help SEO in four distinct ways. Each one adds value in a different part of the search ecosystem. Good SEO for infographics starts long before you open a design tool.
1. Backlink Building
Backlinks remain one of the most powerful ranking signals in Google’s algorithm. Infographics earn backlinks because they give other publishers something truly useful to add to their content.
When other sites republish your infographic, check their pages with our free dofollow link checker, because some sites add nofollow to embed links.
That could be a visual that explains a complex concept, presents data clearly, or summarizes an important topic in a shareable way.
When another site embeds your infographic, they often include a credit link back to your page. At scale, this becomes a passive way to earn links.
A single high-quality infographic can earn dozens or hundreds of backlinks over its lifetime as sites discover and republish it.
2. Google Images Traffic
Google Images generates real search traffic, mainly for visual topics. A well-optimized infographic published on a crawlable page with descriptive alt text and appropriate file naming can rank in Google Images results.
That can drive referral clicks straight to your site. This is a traffic source that most blogs and content teams completely ignore. You can track which queries send this traffic using Google Search Console.
An infographic explaining how SEO works can rank well on its own, since the topic itself carries huge search demand across beginners and practitioners alike. A Google search infographic like this stays evergreen, since the core concepts change slowly.
3. Engagement Signals
A good infographic can keep readers on the page longer, because people stop to scroll through the visual and take in the details. Check it in your own analytics by comparing engagement time on similar pages with and without one.
This engagement behavior is not a direct ranking signal. But it lines up with the content quality signals in Google’s Search Essentials guidelines.
4. Social Shares and Brand Mentions
Infographics are easy to share on social media and in email newsletters, because one image carries the whole story. Each share creates a brand mention and a potential traffic source.
While social signals are not direct ranking factors, widespread sharing exposes the infographic to journalists, bloggers, and publishers. They may then link to it from their own content.
What Makes an Infographic Link-Worthy in 2026
The infographics that earn links today are fundamentally different from those that worked in 2012. The market is saturated with generic visuals. Publishers have become selective. To earn links, an infographic needs to offer something no other piece of content provides as concisely or visually.
Original Data or Research
The single most effective infographic type is one based on original research. Say you conducted a survey, analyzed your own data, or compiled stats from primary sources that no one has assembled in one place before.
An infographic presenting those findings is truly newsworthy. Publishers in your space will want to share it because it gives them exclusive data to cite.
Complex Process Made Visual
Any topic where the concept is difficult to explain in prose but becomes clear with a diagram is a good infographic candidate. Technical SEO workflows, marketing funnel maps, decision trees, and step-by-step processes all work well in visual format.
If a reader looks at your text and would understand it faster as a flowchart, that is a signal it should be visual.
Data Aggregation and Visualization
Even without original research, aggregating and visualizing publicly available data from multiple trusted sources can produce a highly shareable infographic. The value is in how you gather and present it.
Bringing together stats from five government reports and ten industry studies into one clear visual saves your audience hours of research.
Evergreen Comparisons and Reference Material
Comparison charts, decision matrices, and reference guides in visual format earn consistent links over time because they are truly useful reference material.
A visual comparison of SEO tactics by timeframe to results, or a chart of Google Ads bidding strategies, becomes a reference practitioners return to. They then link to it from their own content.
The “Would a Publisher Use This?” Test
Before investing in infographic creation, ask: would a reputable blog in my industry embed this infographic in an article? If the answer is no, because it is generic, promotional, or low-data-quality, it will not earn links.
If the answer is yes, because it presents unique data or makes a genuinely useful concept visual, you have a real link opportunity.
Types of Infographics (and Which One Fits Your Topic)
Infographics and SEO work best together when the format matches the content. Picking the right type before you design saves hours of rework later.
| Type | Best For |
|---|---|
| Statistical | Presenting original survey or research data as charts and numbers |
| Process | Showing a step-by-step workflow or how-to sequence |
| Timeline | Charting events, history, or a policy change over time |
| Comparison | Weighing two or more options, tools, or strategies side by side |
| List | Ranking or grouping tips, tools, or facts under one theme |
| Geographic | Mapping data by region, country, or location |
What infographics can do for a content strategy goes well beyond backlinks. The right type also improves engagement and shares, since a well-matched format is easier to scan.
A statistical infographic suits original research. A process infographic suits a workflow, like the outreach steps later in this guide. Choose the type before opening any design tool.
Best Tools to Design an SEO Infographic in 2026
How to make infographics without hiring a designer? Modern tools cover everyone from complete beginners to in-house design teams.
| Tool | Type | Best Use Case |
|---|---|---|
| Canva | Free / Paid | Template-based design for beginners, the fastest way to create an infographic |
| Visme | Free / Paid | More advanced data-visualization and animation options |
| Piktochart | Free / Paid | Report-style and statistical infographics |
| Adobe Express | Free / Paid | Brand-consistent design for teams already using Adobe tools |
| Napkin AI | AI-assisted | Turning written text or notes into a visual layout automatically |
| NotebookLM | AI-assisted | Summarizing source research before you design around it |
Wondering how to do infographics that actually earn links instead of sitting unseen? Start with the data and the story, then let the tool handle layout.
AI tools speed up first drafts significantly. Every fact and number they generate still needs a human check before you publish, which the next section covers in detail.
Can AI-Generated Infographics Hurt Your SEO?
Are infographics good for SEO when AI helps build them? Usually yes, but only if a human verifies every claim before publishing.
Google’s guidance on generative AI content says AI output must be fact-checked for accuracy before it is published, and a chart is no exception. The concern is not that AI made the graphic. The concern is factual errors reaching readers.
Generic, templated AI output also tends to look the same across many sites, which hurts shareability. Publishers want visuals that feel original, not a stock layout they have already seen elsewhere.
Before You Publish an AI-Assisted Infographic
Fact-check every statistic against its original source. Confirm dates, percentages, and names are accurate. Edit the layout so it does not look like a generic template. Add your own brand voice and original commentary in the supporting text.
Used carefully, AI tools cut design time without cutting quality. Used carelessly, they can spread wrong data under your brand name, which damages trust far more than a slower publishing schedule ever would.
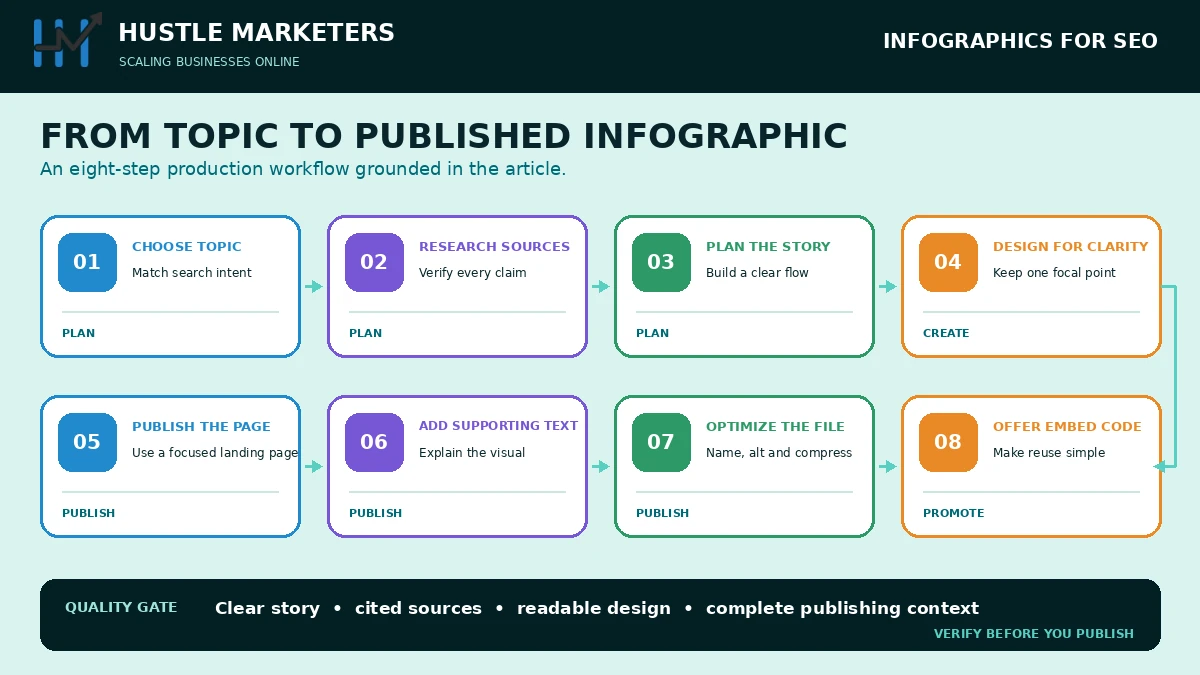
How to Create an SEO-Optimized Infographic: Step by Step
Knowing how to create an infographic that actually ranks takes more than good design software. Each step below builds on the one before it.
Step 1: Choose the Right Topic
Topic selection should be driven by keyword research and link opportunity analysis, not just “what would look good.” Identify topics where:
- There is genuine search volume for the topic
- Sites in your space regularly cover related content (a sign they would share a good visual on the topic)
- Existing content is text-heavy with no strong visual resource
- You can provide data or a process that is genuinely new or better presented than existing resources
Step 2: Research and Source Your Data
Every statistic in your infographic needs a citable source. Using unreliable or outdated data destroys trust and can create bad press instead of good links.
Acceptable sources include original survey data, government publications, academic research, industry group reports, and well-cited in-house studies. Include a sources list at the bottom of the infographic and on the hosting page.
Step 3: Plan the Structure and Story
The best infographics tell a story rather than just displaying data. Plan the visual flow from top to bottom: introduce the topic, then present the core data or process.
Add context or implications, and end with a clear takeaway. A strong visual narrative is far more shareable than a disconnected collection of stats.
Step 4: Design for Clarity and Sharing
Key design principles for link-earning infographics:
- Width: 800 to 1200 pixels is optimal for web embedding and sharing
- File format: PNG for graphics with text; JPEG for photo-based infographics
- File size: compress to under 500KB for fast loading
- Brand: include your logo and website URL in the design itself, not just in the embed code
- Color palette: use your brand colors but ensure sufficient contrast for readability
- Font sizes: all text must be legible at the standard display width; avoid tiny footnotes that are unreadable
Step 5: Publish on a Keyword-Optimized Landing Page
The infographic needs a dedicated home that Google can index and users can link to. This page should include:
- A keyword-relevant URL slug (e.g., /infographic-customer-acquisition-cost/)
- A keyword-targeted H1 and meta title
- A meta description with a clear value proposition
- The infographic embedded as an image with descriptive alt text
- A full written article or transcript below the infographic (see Step 6)
- An embed code widget for easy sharing
- A sources list
Step 6: Add Supporting Text Content
Do not rely on Google reading the text inside an image file. If your page contains only an infographic with no written content, Google has very little text to understand the page or rank it for written searches.
Add a full article, key takeaways section, or detailed transcript below the infographic that covers the same information in text format. This is not optional for SEO: it is the only way the page can rank for written search queries.
Structure the Text as a Full Blog Post
The text below your infographic should not just say “Here is our infographic on X.” It should be a complete, well-structured article with H2s and H3s covering the same topics the infographic visualizes.
This gives the page two chances to earn traffic: from people searching for the infographic, and from people searching for the textual information it contains.
Step 7: Optimize the Image File
SEO image optimization for the infographic file itself:
- File name: use a descriptive, keyword-relevant file name separated by hyphens (e.g., customer-acquisition-cost-infographic-2026.png)
- Alt text: write a clear description of what the infographic shows. Include the main keyword naturally (e.g., “Infographic showing how to calculate and reduce customer acquisition cost for ecommerce brands”)
- Compress the file: use lossless or near-lossless compression to reduce file size without visible quality loss
- Add structured data: ImageObject metadata with a creator, credit or license lets Google Images show who made the infographic. See Google’s Google Images guidance
Step 8: Create an Embed Code
An embed code makes it easy for other sites to display your infographic and automatically link back to your page. Include a copy-paste embed code on the landing page:
Example Embed Code Widget (HTML)
<a href=”https://hustlemarketers.com/your-infographic-page/”> <img src=”https://hustlemarketers.com/images/your-infographic.png” alt=”Infographic title here” width=”800″ /> </a> <p>Via <a href=”https://hustlemarketers.com/”>Hustle Marketers</a></p>
Structured Data for Infographics: Do You Need ImageObject Schema?
ImageObject schema is not required, but it helps Google understand your infographic more precisely. It is a light technical addition most developers can add quickly.
The schema tells Google the image URL and who created it. Google Images can then show creator and credit details, and adding license properties can earn the image a Licensable badge.
Basic ImageObject Schema Example
{ “@type”: “ImageObject”, “contentUrl”: “https://example.com/images/infographic.png”, “caption”: “Infographic title describing the content”, “creator”: {“@type”: “Organization”, “name”: “Your Company”} }
Add this inside your existing structured data, alongside the article or BlogPosting schema already on the page. It complements alt text and descriptive file naming, not replaces them.
A SERP infographic, one that visually breaks down how ranking factors work, benefits especially from this markup, because it states clearly who created the image and how it may be reused.
Where to Find Reliable Data for Your Infographic
Every credible infographic starts with credible data. A few sources consistently hold up to scrutiny and citation.
Trusted Data Sources
- Statista for market and industry statistics
- Pew Research Center for social and technology trend data
- Google Trends for search interest and seasonality data
- Bureau of Labor Statistics for employment and economic data
- Your own first-party survey or product data
- Relevant industry association reports
Always link back to the original source, both in the infographic itself and on the hosting page. This builds trust with readers and protects you if the underlying numbers are later revised.
Infographics in SEO strategy work best when the data is something no competitor has already visualized. Combining two or three sources into one clear chart often beats using just one.
Infographic Distribution and Link Building Outreach
Creating the infographic is only half the work. Without active distribution, even excellent infographics sit unnoticed. Systematic outreach is what separates infographics that earn 3 links from those that earn 300.
1. Identify Outreach Targets
Find sites that have previously published or linked to infographics on your topic. Search Google for your topic + infographic and note which sites appear.
These sites have already shown they are willing to share visual content on your topic. They are your highest-priority outreach targets.
2. Write Personalized Outreach Emails
Generic mass outreach rarely works. Effective infographic outreach emails include:
- A reference to a specific piece of content the publisher has already written on the topic
- A clear explanation of why your infographic adds value to their audience
- A preview image or link to the infographic
- The embed code ready to copy and paste
- A soft, non-pushy close: “Happy to answer any questions” rather than “Please feature this immediately”
3. Submit to Infographic Directories
Several directories and curation sites aggregate infographics by topic. Submitting to them can earn extra links and drive discovery from bloggers and journalists. Google’s guidance on qualifying outbound links means many directories mark these as nofollow.
While these links are rarely high-authority, they still contribute to a natural backlink profile and expand your reach. Avoid directories built purely for link trading, since that pattern can fall under Google’s link spam policies.
4. Share Through Social Channels
Publish the infographic across your social media channels with a link back to the landing page. LinkedIn and Pinterest are very effective for professional and marketing-focused infographics. Pinterest keeps infographics visible for months and can drive ongoing referral traffic long after the initial publish date.
5. Email Newsletter Distribution
If you have an email list, share the infographic with subscribers and encourage them to share it. Subscribers who find it truly valuable may share it with their own audiences. That gives you extra reach beyond your own list.
Guestographics: The Contributor Infographic Outreach Method
A Guestographic is a customized version of your infographic built to fit one specific, already-published article on a target site. It converts better than generic cold outreach.
Instead of asking a publisher to feature your general infographic, you offer something tailored just for their existing content.
The Guestographic Method, Step by Step
- Find a high-performing, relevant article on your target site
- Adapt your infographic’s colors, size, or focus to fit that specific post
- Write a short block of unique text to accompany it
- Offer both free with a credit line, and leave any link to the publisher’s editorial judgment, since Google’s link spam policy covers exchanging goods or services for links
- Follow up once, politely, if you do not hear back within a week
This approach takes more effort per pitch than a mass email blast. It also earns a noticeably higher acceptance rate, since the publisher receives something built specifically for their audience.
Using Mini Infographics for On-Page SEO (Not Just Link Building)
Here’s how to use infographics for SEO beyond just chasing backlinks: embed small ones directly inside your existing blog posts.
A mini infographic breaks up dense sections, making complex information easier to scan. Readers stay on the page longer, which supports the engagement signals covered earlier in this guide.
This works even if the graphic never earns a single external link. The value comes entirely from how it improves the experience on your own page.
Good candidates include a small process diagram inside a how-to post, or a simple comparison chart inside a versus-style article. Keep these lightweight: a few hundred pixels wide, not a full-page graphic.
Infographic Size and Format Cheat Sheet
Different placements need different dimensions. Use this as a quick reference instead of guessing each time.
| Placement | Recommended Size | Format |
|---|---|---|
| Standard blog infographic | 800px wide, 3000 to 6000px tall | PNG for sharp text and lines |
| Pinterest-optimized version | 1000 x 1500px (2:3 ratio) | PNG or high-quality JPEG |
| Social share crop | 1200 x 630px | WebP or compressed JPEG for fast loading |
| Mini on-page infographic | 400 to 600px wide | WebP for smaller file size |
Every image SEO infographic decision comes down to three things: file name, alt text, and compression. Use PNG when text and lines need to stay sharp. Switch to WebP when file size matters more than fine detail.
Infographic SEO Optimization Checklist
Pre-Publication Checklist
- Topic has clear search volume and link opportunity
- Data is sourced from trusted, citable primary sources
- File width is 800 to 1200px; file size under 500KB
- Brand logo and website URL embedded in the design
- Keyword-relevant file name (hyphens, no spaces)
- Dedicated landing page with keyword-optimized URL, H1, and meta tags
- Descriptive alt text written for the image
- Full text article or transcript published below the infographic
- Embed code visible and easy to copy on the landing page
- Sources list included on the page
- Page speed tested: LCP under 2.5 seconds
- Outreach target list prepared before publication
Infographics earn links, but links only move rankings when the pages they point at are built to convert that authority. That is the part most teams skip. Our SEO services cover the site side of this work, and our AI SEO work covers how visual assets get cited in AI answers rather than only in search results.
Links are one input, not the whole engine. Ranking gains usually come from content depth compounding rather than from any single link asset.
How Hustle Marketers uses infographics in SEO
We use infographics sparingly and only where the data is ours. A chart summarizing someone else’s report earns nothing, because there is no reason to cite the summary over the source. A chart built from account data nobody else has is a different asset entirely, and that is the only kind worth commissioning.
The second thing we hold to is that a link asset is worthless if the page it points at cannot convert the authority. Rankings move from content depth compounding rather than from a single graphic. On Rec Hall the number of ranking keywords went from roughly 266 to 517 in six months, and that came from the body of content, not from any one asset.
Ishant Sharma has worked in search since 2013. Content and link work sits under our SEO services, and the AI search question, which increasingly means whether a chart gets described and cited rather than just linked, under AI SEO.
Common Infographic SEO Mistakes
- Publishing on a page with no text content. If the page is just the image, it gives Google almost no text to rank. Always include a full article below the infographic.
- Creating generic, data-free content. Infographics that restate obvious facts with no data or original insight earn no links. Publishers need a reason to share. Original data is the most reliable reason.
- Not including an embed code. Without an embed code, sites that want to share your infographic have to do the HTML work themselves. Most will not bother. An easy copy-paste embed code removes the friction.
- Skipping outreach. Passive distribution (post and pray) does not work at scale. Active outreach to the right publishers is what separates infographics with 3 links from those with 300.
- Making it too long. Infographics that require 20 minutes to scroll through are not shared. The most embeddable infographics focus on one clear theme and present it in a format that can be processed in under 2 minutes.
- Not updating outdated data. An infographic based on 2019 data published in 2026 actively hurts your trust with readers. Keep data-driven infographics updated and refresh the publish date when you do so.
For how infographics fit within a broader content and link building strategy, visit our SEO strategies page. For the technical side of image optimization and on-page SEO, see our advanced SEO techniques guide.
Related guides
More SEO guides from our blog:
Frequently Asked Questions
Do infographics help SEO?
How do infographics build backlinks?
How do I optimize an infographic for SEO?
What makes a good SEO infographic?
Are infographics still effective for link building in 2026?
What is infographic outreach?
How should I write alt text for an infographic?
Should I add text content below an infographic?