Google Ads Benchmarks for Agencies: What ROAS to Promise Clients

Ishant
Published on November 13, 2026
Ishant
Agencies get asked the same question on every sales call: what ROAS will we get? These Google Ads benchmarks for agencies answer it with data from 14 ecommerce Google Ads accounts we manage, published with its full method, and turns the findings into what to promise, what to test and how to report.
Summarize this article with:
Quick Answer: What ROAS should an agency promise a client?
An agency should not promise a ROAS figure. In our Google Ads benchmarks study, the middle half of ecommerce accounts ran Performance Max between 1.87x and 8.42x ROAS. Promise a process, a normal range by campaign type and a break-even line to judge against instead.
Key Observations
- Standard Shopping had a median 5.62x ROAS and Performance Max 4.95x, in accounts with revenue tracking (study table).
- In nine accounts running both, Performance Max won four, Standard Shopping won four and one was a tie, so test both before you sell either (same-account results).
- Brand Search returned a median 16.44x against 3.09x for non-brand, so a blended Search ROAS flatters prospecting (brand split).
- Performance Max took a median 53.1% of ecommerce spend, and more than 75% in five of the 14 accounts (spend table).
- The study covers accounts we manage and does not separate accounts run for partner agencies, so treat it as an agency portfolio benchmark, not a white label one.
Here is the short version agencies can take into a client conversation.
| Campaign type | Median ROAS | Middle half of accounts | What to tell the client |
|---|---|---|---|
| Search (brand) | 16.44x | 9.07x to 32.81x | High because these people already know you. Report it on its own line. |
| Standard Shopping | 5.62x | 4.17x to 11.57x | Strong at the median, but overlaps heavily with Performance Max. |
| Performance Max | 4.95x | 1.87x to 8.42x | The widest spread. Judge it against break-even, not the median. |
| Search (non-brand) | 3.09x | 1.81x to 4.44x | The honest prospecting number. Expect it to sit lowest. |
Source: Google Ads Benchmarks by Campaign Type, ecommerce accounts with revenue tracking, 1 October 2025 to 30 September 2026. Accounts behind each median: brand Search 4, Standard Shopping 9, Performance Max 13, non-brand Search 6.
Want to know where a client account sits against these ranges before you pitch it? Our free audit covers Google Ads and Microsoft Ads, comes back within 48 hours and includes a walkthrough call.
In this guide
- What ROAS should an agency promise a client?
- Where does this benchmark data come from?
- What ROAS range is normal for each campaign type?
- Should agencies sell Performance Max or Standard Shopping?
- Why should agencies report brand and non-brand Search separately?
- How much of a client budget will Performance Max take?
- What CTR and conversion rate are normal by campaign type?
- What should agencies tell lead generation clients?
- Should agencies pitch Demand Gen for ecommerce sales?
- What should an agency promise instead of a ROAS figure?
- How should agencies report these benchmarks to clients?
- How do these figures compare with other Google Ads benchmarks?
- What can this data not tell you?
- Frequently asked questions
Where does this benchmark data come from?
The benchmark data comes from Google Ads accounts Hustle Marketers manages. Ishant Sharma ran the analysis on campaign data for 1 October 2025 to 30 September 2026, pulled through the Google Ads API from 27 accounts. After exclusions, 22 remained: 14 ecommerce and 8 lead generation. The full method is on the study page.
The report and the anonymized account-level dataset are published on Zenodo under a CC BY 4.0 license (DOI 10.5281/zenodo.23719473). That matters for agencies: you can check every figure before you put it in a client deck.
- Metrics: CTR, conversion rate and ROAS only, because the accounts bill in different currencies. No CPC or CPA is reported.
- ROAS: conversion value divided by cost, as Google Ads reports it. Not reconciled with store back ends.
- Thresholds: campaign type cells with under 500 units of spend in the account currency, or under 100 clicks, were dropped.
- Summary: the median account plus the middle half (25th to 75th percentile), so one large account cannot drag the result.
- Brand split: Search campaigns were split into brand and non-brand by campaign name.
Is this a white label PPC benchmark?
No. The study covers accounts we manage, and its published method does not say which of them, if any, we run for partner agencies. So we do not call it a white label benchmark. Read it as what one agency’s ecommerce portfolio looked like over twelve months, which is the same position your agency is in when a client asks what is normal.
What ROAS range is normal for each campaign type?
A normal ROAS depends on the campaign type. In our ecommerce accounts the middle half ran from 9.07x to 32.81x for brand Search, 4.17x to 11.57x for Standard Shopping, 1.87x to 8.42x for Performance Max and 1.81x to 4.44x for non-brand Search. Give clients the range, not the median.
The range is the useful part. A client at 3x on Performance Max sits inside the middle half of our accounts. Whether 3x is good depends entirely on their margins. Performance Max ROAS across all accounts ran from 0.64x to 18.36x, according to the study’s Key Observations.
Use the client’s break-even ROAS as the line that decides good or bad. Break-even ROAS is 1 divided by the gross margin. Our break-even ROAS guide walks through the full calculation, including fees and shipping.
| Client gross margin | Break-even ROAS | Where that sits against our Performance Max range |
|---|---|---|
| 50% | 2.0x | Near the bottom of the middle half (1.87x to 8.42x) |
| 40% | 2.5x | Inside the middle half |
| 25% | 4.0x | Below the 4.95x median |
| 20% | 5.0x | Above the 4.95x median: more than half the Performance Max accounts in the study ran below this line |
Worked arithmetic (1 divided by margin), set against the Performance Max range in our benchmark table. Margins here are examples, not client figures.
This table is the conversation to have before you sign a low-margin store. If its break-even is above the median, say so on the first call.
Why do pooled totals look better than the medians?
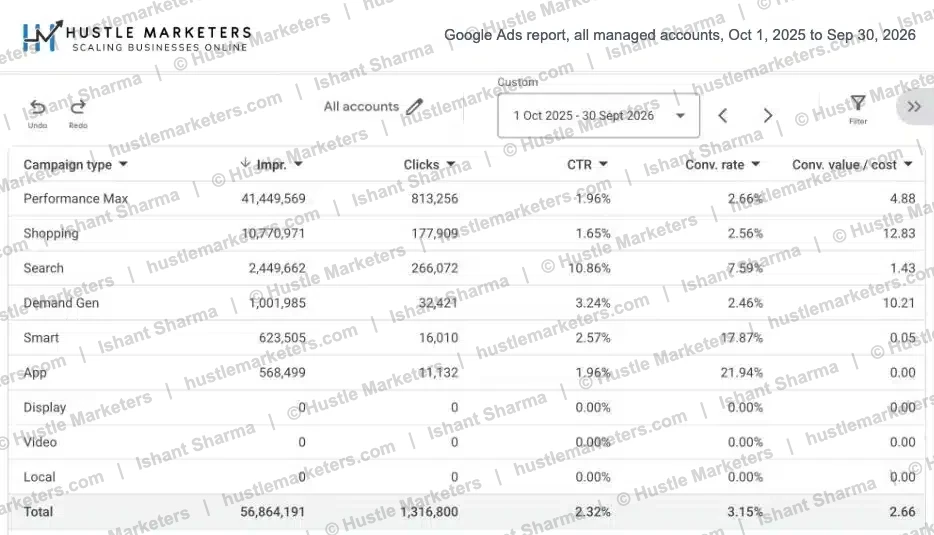
Pooled totals weight the biggest accounts most, so they can look far better than the typical account. Across every account in our manager account, pooled Shopping ROAS showed 12.83x, against the 5.62x median. If a client shows you a big agency’s headline ROAS, ask whether it is pooled or a median.
Should agencies sell Performance Max or Standard Shopping?
Agencies should not sell Performance Max or Standard Shopping as the default. In the nine ecommerce accounts where both had a reportable ROAS, Performance Max was higher in four, Standard Shopping in four, and one was a tie at 18.36x. The medians favor Shopping; account by account, neither won.
| Outcome in the same account | Accounts | Widest example | What it means for your pitch |
|---|---|---|---|
| Performance Max higher ROAS | 4 of 9 | A22: 2.96x against 0.27x for Standard Shopping | Do not promise Standard Shopping will win |
| Standard Shopping higher ROAS | 4 of 9 | A08: 5.36x against 0.64x for Performance Max | Do not promise Performance Max will win |
| Tie | 1 of 9 | A03: 18.36x for both | Campaign type mattered less than the account |
ROAS inside the same account, same dates. The full nine-row table is on the study page, and account codes match the published dataset.
An agency that moves every client to one campaign type will be badly wrong on some of them. A08 and A22 show gaps of several times in opposite directions, inside the same twelve months.
What should you tell a client who asks for Performance Max?
Tell a client who asks for Performance Max that you will run the test in their own account, over the same dates, before moving budget. A short script that stays inside the data:
“In a published study of ecommerce accounts, Performance Max beat Standard Shopping in four accounts and lost in four. So we will not pick a winner from a benchmark. We will run both on your feed, compare them on the same dates and move budget to whichever clears your break-even ROAS.”
Before a Performance Max campaign goes live, we add account-level negative keywords in phrase and exact match. We also exclude irrelevant placements, plus blog and other non-selling URLs. Our white label Performance Max guide covers the setup for agency-owned client accounts.
Why should agencies report brand and non-brand Search separately?
Brand and non-brand Search must be reported separately because brand inflates the total. Brand Search returned a median 16.44x against 3.09x for non-brand in our ecommerce accounts. In the three accounts where both had a reported ROAS, brand ROAS was 4.4 to 13.3 times the non-brand figure.
The gap also shows in conversion rate. Brand campaigns converted better than non-brand in all eight accounts where both met the reporting threshold, across ecommerce and lead generation. If you report one blended Search ROAS, a client cannot see whether you are finding new buyers or just catching people already looking for them.
There is a second trap. Performance Max had a higher ROAS than non-brand Search in all six ecommerce accounts where both had a reported ROAS. Performance Max can serve on brand queries, so part of that return may be brand demand. Set up Performance Max brand exclusions before you show a client that comparison.
- Show brand Search on its own line, with a note that it mostly captures existing demand.
- Show non-brand Search as the prospecting number, and judge it against break-even.
- State whether Performance Max excludes brand terms, so its ROAS can be read honestly.
Our guide to branded vs non-branded search explains how to split the campaigns cleanly.
How much of a client budget will Performance Max take?
Performance Max took a median 53.1% of spend in our 14 ecommerce accounts, and more than 75% in five of them. Tell clients up front that it will likely become the largest line in the account, and explain what that means for risk.
| Campaign type (ecommerce) | Accounts using it | Median share of account spend | What to tell the client |
|---|---|---|---|
| Performance Max | 14 | 53.1% | Likely the biggest line; we watch it most closely |
| Standard Shopping | 13 | 14.5% | Kept as a control and a test against Performance Max |
| Search (non-brand) | 12 | 14.3% | Your prospecting line, judged against break-even |
| Search (brand) | 6 | 6.7% | Small spend, high ROAS, reported separately |
| Demand Gen | 4 | 2.2% | A test budget with its own goal |
Median share of each account’s spend, among accounts using the type. Source: study page.
When one campaign type holds most of the budget, a feed problem, a tracking error or brand traffic inside it moves the whole account. Put that in the proposal as a risk you will monitor, and keep our Performance Max troubleshooting checklist to hand for the first bad week.
What CTR and conversion rate are normal by campaign type?
Normal CTR depends on the campaign type. In our ecommerce accounts brand Search had a median CTR of 30.68%, non-brand Search 7.79%, Performance Max 1.55% and Standard Shopping 1.36%. A 1.5% CTR is normal for Shopping and weak for Search, so never compare a client’s Shopping CTR with a Search benchmark.
| Campaign type (ecommerce) | Median CTR | Median conversion rate | Common client misreading |
|---|---|---|---|
| Search (brand) | 30.68% | 6.68% | “Search is our best campaign” when it is mostly existing demand |
| Search (non-brand) | 7.79% | 2.80% | Compared with brand CTR and called weak |
| Performance Max | 1.55% | 2.99% | Compared with Search CTR and called broken |
| Standard Shopping | 1.36% | 2.21% | Same as Performance Max: product grids get scrolled past |
| Demand Gen | 1.94% | 0.32% | A higher CTR than Shopping read as a sales channel |
Ecommerce accounts, 1 October 2025 to 30 September 2026. Source and middle-half ranges: study page.
Clients often fixate on CTR because it is easy to understand. Put it below ROAS in the report, and label each CTR with its campaign type.
What should agencies tell lead generation clients?
Agencies should tell lead generation clients that Google Ads conversion rates are not lead quality. In our eight lead generation accounts, the median conversion rate was 19.73% for brand Search, 9.62% for Local Services Ads, 7.71% for Performance Max and 6.17% for non-brand Search.
The study reports no ROAS for lead generation, because lead values were not set the same way in every account. That is a useful line for client calls too. If lead values are guesses, a lead generation ROAS is a guess.
- Non-brand Search took the largest median share of spend in lead generation, at 49.2%, with Performance Max at 35.5%.
- Local Services Ads converted better than non-brand Search in three of the four accounts that ran both.
- A higher Performance Max conversion rate is not proof of better leads. Check what each conversion turns into in the CRM.
Source: lead generation section of the study.
Should agencies pitch Demand Gen for ecommerce sales?
Agencies should pitch Demand Gen as a test budget, not a sales channel. It took a median 2.2% of ecommerce spend in the four accounts that used it. In the three that met the reporting threshold, ROAS was 0.07x, 2.04x and 14.78x, a spread too wide to promise anything.
Agree a separate success measure for Demand Gen before launch, and keep it out of the headline ROAS until it earns a place. Our Demand Gen guide covers bidding and audiences.
What should an agency promise instead of a ROAS figure?
An agency should promise a written process, a timeline and a reporting standard. We never promise a ROAS, CPA or cost per lead, because the spread between accounts is wider than any target we could defend. These are the commitments we do make, and they work as a proposal template.
- Days 1 to 2: access and tracking checks, because duplicate purchases or missing values move every ROAS number.
- Days 3 to 4: an audit of the account, feed and campaign mix.
- Days 5 to 7: negative keywords and structure, with negatives built at account level before launch.
- From day 8: new Search campaigns launch on exact match, with daily search term reviews for roughly the first 15 days. Broad match comes later, once there is conversion data.
- After about 30 stable days: target ROAS is set, then raised in 15 to 20% steps, always judged against break-even ROAS.
- New goals get their own campaign: if a client wants new customers, live campaigns are left alone and the goal is tested in a separate campaign that excludes the existing customer list.
Google says the same about guarantees from its side. Its advertiser guide to working with third parties says a specific ad position on Google search results cannot be guaranteed, and that advertisers have the right to know their clicks, impressions and total cost.
Pitching a new ecommerce client? We can audit the account first and show you which campaign types clear its break-even line, so your proposal promises only what the account can support.
How should agencies report these benchmarks to clients?
Agencies should report each campaign type against its own normal range and against the client’s break-even ROAS, with brand split out and the sample size shown. A benchmark without its sample size is a number a client will remember and misuse.
| Report line | What to show | Why |
|---|---|---|
| Headline | Account ROAS against break-even ROAS | Profit decides success, not the median |
| Brand Search | ROAS and spend on their own line | Median 16.44x would hide weak prospecting |
| Non-brand Search | ROAS against the 1.81x to 4.44x middle half | The true prospecting result |
| Shopping and Performance Max | Side by side, same dates | Neither won outright in our nine-account comparison |
| Budget concentration | Performance Max share of spend | Median 53.1% means one campaign moves the account |
| Change log | Every change with a date | Explains movement before the client asks |
| Benchmark footnote | Source, sample size, dates | Stops a median being read as a promise |
Figures from the Google Ads benchmarks study. Report structure is ours.
We send clients a weekly Looker Studio report judged against break-even ROAS, plus a dated change log. In accounts we run white label for agencies, every change is agreed with the agency before it goes live and logged with a date, and the account stays in the agency’s or client’s name. Our guides to white label PPC reporting and PPC reporting go deeper on layout.
How do you cite the benchmark in a client deck?
Credit Hustle Marketers, link to the study page or the DOI, and keep the sample size next to the figure. A footnote that works:
Source: Sharma, I. (2026). Google Ads Performance Benchmarks by Campaign Type. Hustle Marketers. Ecommerce accounts with revenue tracking, 1 October 2025 to 30 September 2026. doi.org/10.5281/zenodo.23719473
How do these figures compare with other Google Ads benchmarks?
Two other studies that use Google Ads reporting, compared on our study page, also put Shopping ahead of Performance Max at the median. In those three studies, Shopping’s median ROAS was 6% to 26% above Performance Max. That gap is small next to the spread between accounts, which is why the client’s own account decides.
| Source | Sample | Performance Max | Standard Shopping |
|---|---|---|---|
| Hustle Marketers | Ecommerce accounts we manage, Oct 2025 to Sep 2026 | 4.95x | 5.62x |
| Top Growth Marketing | 28 DTC brands, Sep 2025 to Aug 2026 | 3.90x | 4.13x (labeled Shopping) |
| Visionary Marketing | 84 audited accounts running both, Jan to Feb 2026 | 2.7x | 3.4x |
Medians as published by each source, read on 2 November 2026 and shown on our study page, which also covers Cassandra’s marketing mix model figures.
For agencies, the practical point is simple. Every published median sits inside a wide spread, so use outside benchmarks as a sense check and the client’s own data for budget decisions.
What can this data not tell you?
The benchmark data cannot tell you what any one client will achieve. It is one agency’s portfolio, with three to fourteen accounts behind each summarized campaign type, so a single account can move a median. Say that out loud whenever you show a client these numbers.
- Conversion definitions and attribution settings differ between accounts.
- Performance Max can serve on brand queries, so comparisons with Shopping and Search are descriptive, not causal.
- Figures are as reported by Google Ads, not reconciled with store or CRM data.
- The accounts span several countries and currencies, so only ratios are reported.
- The study does not separate accounts run for partner agencies from accounts run directly for brands.
Full list: limits of the data. More studies sit in the Hustle Marketers research hub.
Frequently asked questions
What ROAS should I promise a new ecommerce client?
None. Promise a process, a timeline and a reporting standard instead. In our ecommerce accounts, the middle half of Performance Max accounts ran from 1.87x to 8.42x ROAS, so any single figure would be a guess. Judge results against the client’s break-even ROAS.
Is Performance Max better than Standard Shopping for client accounts?
Not by default. In nine ecommerce accounts running both, Performance Max had the higher ROAS in four, Standard Shopping in four, and one was a tie. Test both in the client’s own account over the same dates before moving budget.
Why is brand Search ROAS so much higher than non-brand?
Brand Search mostly reaches people already looking for the store. In our ecommerce accounts it returned a median 16.44x against 3.09x for non-brand Search. Report the two on separate lines so brand does not hide weak prospecting.
Is this a white label PPC benchmark?
No. The study covers 22 Google Ads accounts Hustle Marketers managed from October 2025 to September 2026. Its method does not separate accounts run for partner agencies, so it is an agency portfolio benchmark, not a white label one.
Can my agency use these figures in client reports or proposals?
Yes. The report and dataset are published under a Creative Commons Attribution 4.0 license. Credit Hustle Marketers, link to the study page or DOI 10.5281/zenodo.23719473, and keep the sample size next to any figure you quote.
What CTR is normal for Shopping and Performance Max?
About 1.4% to 1.6% at the median in our ecommerce accounts: 1.36% for Standard Shopping and 1.55% for Performance Max. Search runs much higher, at 7.79% for non-brand, so compare each CTR only with its own campaign type.
When can a new account’s ROAS be judged fairly?
Not in the first weeks. We run new Search campaigns on exact match for roughly the first 15 days and set target ROAS only after about 30 stable days. Until then, report setup progress and search term quality rather than a final ROAS.
What is the next step for your agency?
Take the ranges above into your next client call, report brand on its own line and judge every campaign type against break-even ROAS. If you want a second pair of hands on the accounts themselves, see our white label PPC services, priced by how many client accounts you need covered.
Send us one client account and we will show you its campaign mix, brand share inside Performance Max, feed quality and tracking against these benchmarks. Delivered within 48 hours, with a walkthrough call.
How we made this guide: every figure comes from the published study page and its Zenodo record, read on 13 November 2026. The agency talk track, report layout and break-even examples are ours. An AI assistant helped draft the text, and a person fact-checks it before publishing.