These Google Ads benchmarks by campaign type come from 22 accounts we managed between October 2025 and September 2026. In the 14 ecommerce accounts, Performance Max took a median 53.1% of spend. In the 13 with revenue tracking, it returned a median 4.95x ROAS, against 5.62x for Standard Shopping, 3.09x for non-brand Search and 16.44x for brand Search.
Key Observations
- Standard Shopping beat Performance Max at the median (5.62x against 4.95x), yet each won four of nine same-account comparisons.
- Performance Max ROAS ranged from 0.64x to 18.36x, so the median hides a wide spread.
- Brand Search returned 16.44x against 3.09x for non-brand, and converted better in all eight accounts where both were reported.
- In lead generation, non-brand Search took the largest share of spend (49.2%) and converted at 6.17%.
- Demand Gen took just 2.2% of ecommerce spend, with ROAS from 0.07x to 14.78x.
How to read these numbers
- Median: the middle account. Half the accounts did better and half did worse.
- Middle half: the range covered by the middle 50% of accounts (25th to 75th percentile). A wide range means results varied a lot.
- ROAS: conversion value divided by ad cost, as reported by Google Ads. 4x means tracked sales were four times the ad spend.
- Brand Search targets searches for the store’s own name. Non-brand Search targets everything else.
- Accounts: how many accounts sit behind a figure. Fewer accounts means a less stable figure.
What ROAS does Performance Max get compared with Standard Shopping and Search?
Among our ecommerce accounts with revenue tracking, Standard Shopping had the highest median ROAS of the prospecting campaign types, at 5.62x. Performance Max came next at 4.95x, then non-brand Search at 3.09x. Brand Search returned 16.44x, but it mostly captures people already searching for the store, so it is not a fair prospecting benchmark.
| Campaign type | Median ROAS | Middle half of accounts | Accounts |
|---|---|---|---|
| Search (brand) | 16.44x | 9.07x to 32.81x | 4 |
| Standard Shopping | 5.62x | 4.17x to 11.57x | 9 |
| Performance Max | 4.95x | 1.87x to 8.42x | 13 |
| Search (non-brand) | 3.09x | 1.81x to 4.44x | 6 |
| Demand Gen | 2.04x | 1.05x to 8.41x | 3 |
Two numbers matter more than the medians. First, the middle half of Performance Max accounts spans 1.87x to 8.42x, a gap of more than four times. Second, Shopping and Performance Max overlap heavily, so a store at 3x on Performance Max sits inside the middle half of our accounts. Whether that is profitable depends on its break-even ROAS.
What this means for you: a Performance Max ROAS between about 2x and 8x is normal in our data. Judge yours against your break-even ROAS, not against the median.
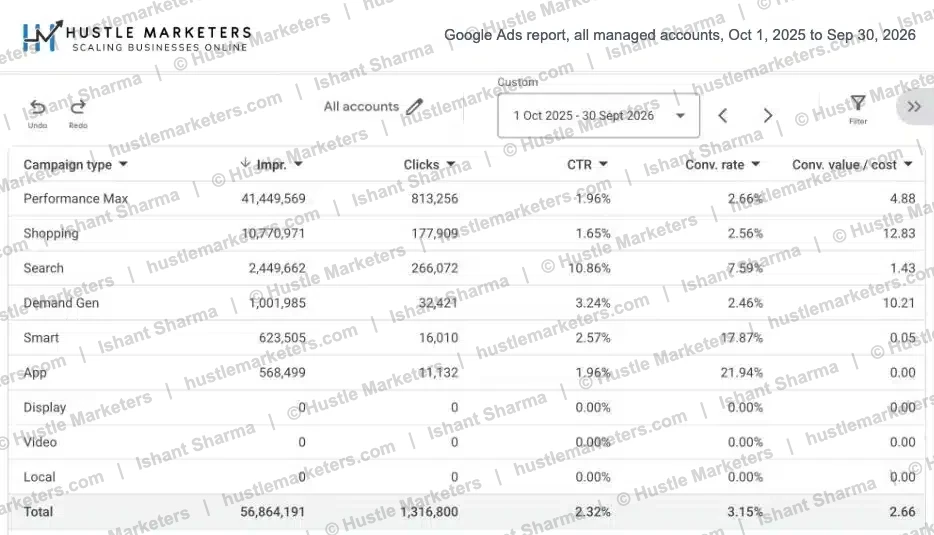
For a wider view, here is the Google Ads report for every account in our manager account, by campaign type, over the same dates. These are pooled totals, so the biggest accounts weigh the most. That is why Shopping shows 12.83x here, against a 5.62x median. The pattern still holds: Shopping returned more than Performance Max, and Search had by far the highest CTR.
Is Performance Max or Standard Shopping better in the same account?
Nine ecommerce accounts had both campaign types above the reporting threshold, with revenue tracking. Performance Max had the higher ROAS in four, Standard Shopping in four, and one was a tie at 18.36x. The pooled medians suggest Shopping wins; account by account, neither type came out ahead.
What this means for you: test both campaign types in your own account, over the same dates, before you move budget between them.
| Account | Performance Max ROAS | Standard Shopping ROAS | Higher ROAS |
|---|---|---|---|
| A02 | 10.07x | 8.74x | Performance Max |
| A03 | 18.36x | 18.36x | Tie |
| A06 | 8.34x | 11.57x | Standard Shopping |
| A07 | 7.30x | 4.17x | Performance Max |
| A08 | 0.64x | 5.36x | Standard Shopping |
| A09 | 2.26x | 2.83x | Standard Shopping |
| A11 | 14.85x | 12.44x | Performance Max |
| A20 | 4.95x | 5.62x | Standard Shopping |
| A22 | 2.96x | 0.27x | Performance Max |
The widest gaps ran in both directions. In account A08, Standard Shopping returned 5.36x while Performance Max returned 0.64x. In account A22 it was the other way around: Performance Max returned 2.96x and Standard Shopping 0.27x.
Neither type won in more than four of the nine accounts. So this data does not support a blanket rule like “always move to Performance Max” or “always keep Shopping”.
From our accounts: We do not pick a winner from a benchmark. Before a Performance Max campaign goes live, we add account-level negative keywords in phrase and exact match. We also exclude irrelevant placements, plus blog and other non-selling URLs, so the campaign only sends traffic to pages that convert.
Why do PPC forums disagree about Performance Max and Shopping?
Practitioners report both outcomes. One r/PPC user wrote that “feed-only PMax beats standard shopping almost every time” in their testing (r/PPC thread). Another called Standard Shopping plus Search “the safer bet for most accounts under $50k/month spend” (r/PPC thread). Our four-four split shows why both can be right in their own accounts.
Some forum answers still say Performance Max always takes priority over Standard Shopping. That changed in October 2024. Now, when Shopping and Performance Max campaigns overlap, Ad Rank decides which one serves, as reported by PPC Land, citing Mike Ryan of Smarter Ecommerce.
Google’s help page on how Performance Max interacts with other campaigns says the campaign with the highest Ad Rank gets priority. The page does not name Standard Shopping.
Not sure which campaign type deserves your budget? We review your campaign mix, brand traffic in Performance Max, feed quality and tracking, and show you where the gaps are. Get Free Audit Worth $500
How much of the budget does Performance Max take?
Performance Max took a median 53.1% of spend in the 14 ecommerce accounts, and more than 75% in five of them. In lead generation accounts it took a median 35.5%, while non-brand Search stayed the largest line at 49.2%. In ecommerce, Performance Max took the largest median share of spend; in lead generation, non-brand Search did.
| Business model | Campaign type | Accounts using it | Median share of account spend |
|---|---|---|---|
| Ecommerce | Performance Max | 14 | 53.1% |
| Ecommerce | Standard Shopping | 13 | 14.5% |
| Ecommerce | Search (non-brand) | 12 | 14.3% |
| Ecommerce | Search (brand) | 6 | 6.7% |
| Ecommerce | Demand Gen | 4 | 2.2% |
| Lead generation | Search (non-brand) | 8 | 49.2% |
| Lead generation | Performance Max | 8 | 35.5% |
| Lead generation | Smart campaigns | 2 | 20.1% |
| Lead generation | Local Services Ads | 4 | 9.8% |
| Lead generation | Demand Gen | 2 | 3.9% |
| Lead generation | Search (brand) | 5 | 2.3% |
| Lead generation | Display | 1 | 0.2% |
Heavy concentration is a risk worth checking. When one campaign type takes most of the budget, a feed problem, a tracking error or brand traffic inside that campaign moves the whole account. Our Performance Max troubleshooting guide covers what to check first.
What is a good ROAS for brand vs non-brand Search?
Brand Search returned a median 16.44x against 3.09x for non-brand Search in ecommerce accounts. In the three ecommerce accounts where both had a reported ROAS, brand ROAS was 4.4 to 13.3 times the non-brand figure. Report the two separately, or blended Search ROAS will make prospecting look far better than it is.
The same gap shows in conversion rate. Brand campaigns converted better than non-brand in all eight accounts where both met the reporting threshold, across ecommerce and lead generation. In lead generation, brand Search converted at a median 19.73%, about three times the 6.17% of non-brand Search. Our guide to branded vs non-branded search explains how to split them.
Performance Max had a higher ROAS than non-brand Search in all six ecommerce accounts where both had a reported ROAS. Read that with care. Performance Max can serve on brand queries, so part of its return may be sales that brand Search would catch anyway. Use brand exclusions before you compare the two.
What is the average CTR in Google Ads by campaign type?
CTR depends on the campaign type, so compare yours with the same type only. In our ecommerce accounts brand Search had a median CTR of 30.68%, non-brand Search 7.79%, Performance Max 1.55% and Standard Shopping 1.36%. A 1.5% CTR is normal for Shopping and Performance Max and weak for Search.
| Campaign type | Median CTR | Middle half | Median conv. rate | Middle half |
|---|---|---|---|---|
| Search (brand) | 30.68% | 26.75% to 33.04% | 6.68% | 5.29% to 8.06% |
| Standard Shopping | 1.36% | 1.05% to 1.70% | 2.21% | 1.90% to 4.81% |
| Performance Max | 1.55% | 1.15% to 2.25% | 2.99% | 1.71% to 4.83% |
| Search (non-brand) | 7.79% | 6.90% to 10.34% | 2.80% | 1.23% to 4.12% |
| Demand Gen | 1.94% | 1.17% to 2.62% | 0.32% | 0.19% to 0.53% |
Performance Max and Shopping CTRs look low because their impressions include product grids, YouTube and other placements where people scroll past many ads. Search CTRs look high because the ad answers a typed query. Neither number says much about profit on its own.
What is the average Google Ads conversion rate for lead generation?
In eight lead generation accounts, the median Google Ads conversion rate was 19.73% for brand Search, 9.62% for Local Services Ads, 7.71% for Performance Max and 6.17% for non-brand Search. These are conversion rates as tracked in Google Ads, so they do not measure lead quality. We do not report ROAS here, because lead values were not set the same way in every account.
| Campaign type | Median CTR | Middle half | Median conv. rate | Middle half |
|---|---|---|---|---|
| Search (brand) | 22.14% | 12.64% to 26.89% | 19.73% | 19.08% to 21.17% |
| Search (non-brand) | 4.74% | 3.05% to 7.56% | 6.17% | 5.18% to 12.15% |
| Performance Max | 3.02% | 1.31% to 6.33% | 7.71% | 5.88% to 13.58% |
| Local Services Ads | 11.60% | 9.83% to 13.55% | 9.62% | 7.09% to 10.64% |
Local Services Ads converted better than non-brand Search in three of the four accounts that ran both. A higher Performance Max conversion rate is not proof of better leads, so check what each conversion turns into. Our guide to spam leads from Google Ads shows how to spot the difference, and the Local Services Ads guide covers setup.
What this means for you: judge lead generation campaigns on qualified leads in your CRM, not on the conversion rate Google Ads reports.
Does Demand Gen drive ecommerce sales?
Demand Gen played a small part in our ecommerce accounts: a median 2.2% of spend in the four accounts that used it. In the three that met the reporting threshold, ROAS was 0.07x, 2.04x and 14.78x. That spread is too wide to call Demand Gen a sales channel or a waste; it depends on the account and the offer.
Treat Demand Gen as a test budget with its own success measure, not a replacement for Shopping or Performance Max. Our Demand Gen guide covers bidding, audiences and the Display migration.
How do these numbers compare with other published Google Ads benchmarks?
Two other studies that report Google Ads ROAS by campaign type also put Shopping ahead of Performance Max at the median, as we found. Cassandra’s incrementality models put Performance Max ahead. The table sets each source’s medians next to ours, with the data behind each figure.
| Source | Sample | Performance Max | Standard Shopping | Search |
|---|---|---|---|---|
| This study | 14 ecommerce accounts we manage, Oct 2025 to Sep 2026 | 4.95x | 5.62x | 3.09x non-brand, 16.44x brand |
| Top Growth Marketing | 28 DTC brands (25 PMax, 15 Shopping and 22 Search accounts), Sep 2025 to Aug 2026 | 3.90x | 4.13x (labeled Shopping) | 4.91x (brand and non-brand combined) |
| Visionary Marketing | 84 audited accounts running both types, Jan to Feb 2026 | 2.7x | 3.4x | Not reported |
| Cassandra | 253 marketing mix models, 59 advertisers, 2023 to 2025 | 4.64x | 3.09x (labeled Shopping) | 5.21x non-brand, 4.14x brand |
In the three studies here that use Google Ads reporting, Shopping’s median ROAS was 6% to 26% above that of Performance Max. That gap is small next to the spread between accounts, so the result inside your own account matters more than any median.
In Cassandra’s marketing mix models, brand Search returned less than non-brand: 4.14x against 5.21x, with overlapping confidence intervals. In Google Ads reporting in our accounts, brand returned 16.44x. Brand ROAS in the platform is best read as an upper limit, because some of those sales would probably have happened without the ad.
Most industry-wide figures do not split brand and non-brand Search. One example is the median 6.64% CTR and 8.18% conversion rate in WordStream’s 2026 study of 13,474 US search advertising campaigns (April 2025 to March 2026). Compare them with your blended Search numbers, not with a single campaign type.
What this means for you: use outside benchmarks as a sense check, and your own account data for budget decisions.
How should you use Google Ads benchmarks by campaign type?
Use these ROAS, CTR and conversion rate benchmarks to check whether a number is normal, not to set targets. The target that matters is your break-even ROAS, which comes from your margins. A 3x ROAS can be a profit for one store and a loss for another. So compare each campaign type with your own break-even point first.
- Work out your break-even ROAS with the ROAS calculator or our guide to calculating break-even ROAS.
- Split brand and non-brand Search before comparing anything with the table above.
- Compare Performance Max and Standard Shopping inside your own account over the same dates, not against the medians.
- Check tracking before trusting any ROAS: duplicate purchases or missing values move every number on this page.
- If you run lead generation, judge campaigns on qualified leads, not tracked conversions alone.
The difference between ROAS, break-even ROAS and target ROAS is explained in our ROAS comparison guide.
Want to see how your campaign types compare with these benchmarks? We review your campaign mix, brand traffic in Performance Max, feed quality and tracking, and show you where the gaps are. Get Free Audit Worth $500
How was this data collected?
We pulled campaign-level data for October 1, 2025 to September 30, 2026 through the Google Ads API from 27 accounts we manage. After exclusions, 22 accounts remained: 14 ecommerce and 8 lead generation. Together they had 46,901,558 impressions, 960,836 clicks and 57,228 conversions. Of those conversions, 10,012 are micro-conversions from the one account kept for CTR only.
- Excluded: three accounts that could not be retrieved, one with no spend, and one whose spend scale and conversion tracking were not comparable. One ecommerce account that records micro-conversions was kept for CTR only. App campaigns were excluded.
- Search campaigns were split into brand and non-brand by campaign name.
- Metrics were summed per account and campaign type. Cells with less than 500 units of spend in the account currency, or fewer than 100 clicks, were dropped.
- Only ratios are reported (CTR, conversion rate and ROAS), because the accounts bill in different currencies. Cost per click and cost per acquisition are not reported.
- Each campaign type is summarized as a median with the 25th to 75th percentile range. CTR, conversion rate and ROAS are not summarized for types with fewer than three accounts; the spend table lists every type used.
- Accounts are coded A01 to A22. No client names, campaign names, account IDs or money totals are published. Most client work is covered by NDAs.
What are the limits of this data?
This is one agency’s portfolio, not the whole market. Each summarized campaign type has three to fourteen accounts, so a single account can move a median. The figures describe what happened in accounts we manage, under our management approach, and should be read as reference points rather than industry averages.
- Conversion definitions and attribution settings differ between accounts.
- Performance Max can serve on brand queries and follows Google’s attribution, so the comparison with Shopping and Search is descriptive, not causal.
- Brand and non-brand split relies on campaign names.
- All figures are as reported by Google Ads and were not reconciled with store back ends or CRM data.
- The accounts span several countries and currencies.
How do I cite or download this data?
The full report and the anonymized account-level dataset are published on Zenodo under a Creative Commons Attribution 4.0 license, with the DOI 10.5281/zenodo.23719473. You can quote any figure on this page with a credit and a link.
Free to use and cite
Sharma, I. (2026). Google Ads Performance Benchmarks by Campaign Type: Evidence from 22 Agency-Managed Accounts, October 2025 to September 2026. Hustle Marketers. https://doi.org/10.5281/zenodo.23719473
Download: account-level dataset (CSV) and full report (PDF).
More of our published data sits in the Hustle Marketers research hub, including PPC statistics from 44 US businesses and Microsoft Ads and Google Ads CPC data.
FAQ
What is a good CTR for Google Ads?
It depends on the campaign type. In our ecommerce accounts the median CTR was 30.68% for brand Search, 7.79% for non-brand Search, 1.55% for Performance Max and 1.36% for Standard Shopping. Compare your CTR with the same campaign type, not with an account-wide average.
What is the average conversion rate for Google Ads?
Medians beat averages here. In our ecommerce accounts, median conversion rates ran from 0.32% for Demand Gen to 6.68% for brand Search, with Performance Max at 2.99%. In lead generation accounts they ran from 6.17% for non-brand Search to 19.73% for brand Search.
Why choose Standard Shopping over PMax?
The usual reason is control: you see search terms, set bids by product group and keep brand traffic out. In our data neither type won outright. In the nine accounts where both had a reportable ROAS, Performance Max was higher in four and Standard Shopping in four, with one tie.
Does PMax take priority over Standard Shopping?
Not automatically anymore. Since a change reported in October 2024, when Performance Max and Standard Shopping campaigns compete for the same auction, the campaign with the higher Ad Rank serves. Google’s help page also says a Search keyword that exactly matches the query is preferred over Performance Max.
We are at 4x ROAS but barely breaking even. What should we check?
Start with your break-even ROAS, which comes from your margins, fees and shipping. If 4x is close to break-even, check how much of the return is brand traffic, whether tracking double counts purchases, and which products sell at a loss. A 4x median says nothing about your margins.
Can I use this data in my own article or report?
Yes. The dataset and report are published under a Creative Commons Attribution 4.0 license. Credit Hustle Marketers, link to this page or to the DOI 10.5281/zenodo.23719473, and keep the sample size next to any figure you quote.
Sources
- Sharma, I. (2026). Google Ads Performance Benchmarks by Campaign Type: Evidence from 22 Agency-Managed Accounts. Zenodo.
- Google Ads Help: How Performance Max interacts with other campaigns in your account
- PPC Land: Performance Max vs Standard Shopping, Google revamps ad auction (October 2024)
- r/PPC: Standard Shopping vs. PMax “Shopping only”
- r/PPC: PMax Feed only + search or Standard shopping + search
- Top Growth Marketing: Google Ads benchmarks for DTC ecommerce
- Visionary Marketing: Performance Max statistics
- Cassandra: Google Ads benchmarks, ROI by campaign type
- WordStream: Google Ads benchmarks