Camping Equipment PPC Case Study: Google Ads, Shopping and Meta Ads for a UK Outdoor Brand

Ishant
Published : November 4, 2026 at 6:23 pm
Updated : November 4, 2026 at 6:23 pm
Ishant
By Ishant Sharma, a Google Ads specialist working in digital marketing since 2013 and founder of Hustle Marketers™. Published 4 November 2026. All figures were read from the live Google Ads and Meta Ads accounts on 4 November 2026.
This camping equipment PPC case study covers a UK brand that sells lightweight tents, sleep systems and camp cookware online. Our work for this client is covered by an NDA, so we do not name the brand, its products or its campaigns. Hustle Marketers runs their Google Ads (Standard Shopping, Performance Max and Search) and their Meta Ads, and looks after the Merchant Center and GA4 setup that sits behind them.
The short version: from 1 April to 30 September 2026, Google Ads spent £15,702 and tracked £273,256 in purchase value, a return of 17.40 for every £1 of ad cost. Over the same six months, Meta Ads spent £5,383 and reported £69,612 in purchase value, a return of 12.93.
Every figure below comes from the ad platforms, and the screenshots show the date range on screen. We also explain what the numbers do not show, because a ROAS figure without its caveats is a claim, not a report.
Key Observations
- Google Ads recorded 1,658 purchases at £9.47 each, with £273,256 in purchase value on £15,702 of spend across all campaigns.
- Standard Shopping carried the account: 72 percent of spend and 72 percent of purchase value, at a return of 17.46.
- Three tent products took 31 percent of product-level ad cost but brought in 47 percent of product-level purchase value, a return of 27.12.
- A tents-only Performance Max campaign, launched in July, returned 22.67 on £2,027 of spend.
- Non-brand Search returned 9.10, about half of Shopping’s return, and took 3 percent of spend.
- From June to August, monthly spend rose 3.7 times and purchase value roughly doubled, while return per £1 fell from 28.30 to 15.28. That is the trade-off of buying more of the peak season.
- Meta Ads recorded 411 purchases at £13.10 each. Test campaigns for Norway, Germany and the Netherlands spent £447 for 2 purchases and were switched off.
- The client rated the work 5.0 out of 5 in a verified review on Clutch.
Camping Equipment PPC Case Study at a Glance
| Detail | Information |
|---|---|
| Client | UK camping equipment brand, name withheld under NDA |
| Location | England, selling online |
| Company size | 1 to 10 employees, as listed on the client’s Clutch review |
| Products advertised | Lightweight tents, sleep systems (quilts, sleeping bags, pads and pillows), titanium camp cookware, chairs and sit pads, trekking poles |
| Channels we manage | Google Ads (Standard Shopping, Performance Max, Search), Meta Ads, Merchant Center and GA4 |
| Period covered | 1 April to 30 September 2026 |
| Currency | British pounds (GBP) |
| Google Ads conversion counted | Website purchases only (one conversion action) |
| Meta Ads attribution | 7-day click, 1-day view or 1-day engagement |
| Engagement | Ongoing, with a monthly performance report |
Want to see where your own outdoor store is losing sales? Get Free Audit Worth $500
Why Is Google Ads for Camping Equipment Different?
Camping gear is a considered purchase. In this account each Google Ads purchase was worth about £165 on average, and buyers of lightweight gear tend to compare weight, size, season rating and price before they buy. Product image ads did most of the selling, and a few hero products carried the account.
A small number of products carry the account
The Google Ads products report lists 53 products across five categories. Three of them are tents, and those three brought in £119,153 of the £253,666 product-level purchase value. When a few products earn most of the money, they need their own budget, so a slow seller cannot take their share.
Shopping beats text ads for gear
Standard Shopping returned 17.46 and non-brand Search returned 9.10. A shopper looking for a lightweight tent wants to see the tent and the price next to rival products, and a text ad cannot show that. Search ran on a £30 daily budget and took 3 percent of spend.
Demand follows the season, and budget caps decide how much of it you get
Clicks rose from 9,231 in April to 14,939 in August. Across the period the account still lost 22 percent of its eligible search impression share to budget, and the main Shopping campaign lost 25 percent. Budgets, not bids, were the main limit on how much summer demand the brand could buy.
What Did Google Ads Deliver From April to September 2026?
 Hustle Marketers™
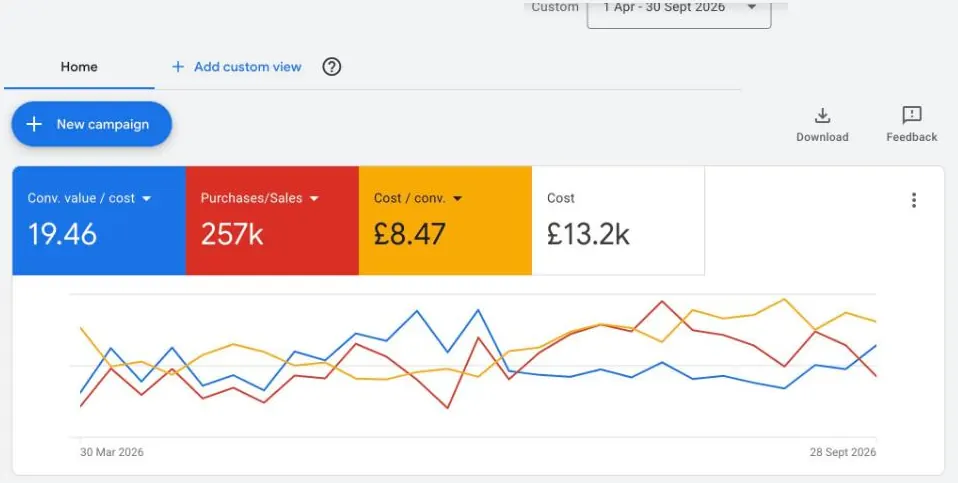
The screenshot shows the four campaigns that are live today. To keep the numbers honest, the table below uses the full account total, which includes campaigns that were paused or removed during the period. Including them lowers the headline return from 19.46 to 17.40.
| Metric | All campaigns in the account | Four live campaigns |
|---|---|---|
| Ad cost | £15,702.30 | £13,219.99 |
| Purchases | 1,657.72 | 1,560.88 |
| Purchase value | £273,255.84 | £257,195.63 |
| Purchase value per £1 of cost (ROAS) | 17.40 | 19.46 |
| Cost per purchase | £9.47 | £8.47 |
| Clicks | 68,892 | 59,837 |
| Average cost per click | £0.23 | £0.22 |
| Conversion rate | 2.23% | 2.39% |
| Impressions | 4,024,846 | 3,421,482 |
Purchases show decimals because Google Ads shares the credit for one sale across several ad clicks under data-driven attribution. If you want to check what return your own margins need, our ROAS calculator works out your break-even figure.
Which Google Ads Campaign Types Did the Work?
Standard Shopping took most of the budget and most of the sales. Performance Max returned slightly more per £1, and both of its campaigns ran on selected product groups rather than the whole catalog. Search stayed small.
| Campaign type | Cost | Share of cost | Purchases | Purchase value | ROAS | Cost per purchase |
|---|---|---|---|---|---|---|
| Standard Shopping | £11,271.26 | 71.8% | 1,318.43 | £196,786.68 | 17.46 | £8.55 |
| Performance Max | £3,901.00 | 24.8% | 307.22 | £71,644.53 | 18.37 | £12.70 |
| Search (non-brand) | £530.04 | 3.4% | 32.06 | £4,824.63 | 9.10 | £16.53 |
| Total | £15,702.30 | 100% | 1,657.72 | £273,255.84 | 17.40 | £9.47 |
How were the live campaigns set up?
- Own-brand Standard Shopping at £50 a day: £8,839 of spend, a return of 20.45 and an average cost per click of £0.18. It lost 25 percent of its eligible impression share to budget over the period.
- Tents-only Performance Max at £40 a day, which first spent in July: Google Ads shows 96 percent of the catalog excluded from it, so it spends on tents only. It returned 22.67 on £2,027.
- Performance Max for a wider group of selected products at £30 a day: a return of 14.08 on £1,824.
- Non-brand Search at £30 a day: a return of 9.10 on £530, with a 9.88 percent click-through rate.
Splitting Performance Max by product group stops the tents from competing with lower-margin items for the same budget. Our guide to custom labels and margin tiers in Google Shopping shows how to set that up, and Performance Max versus Search covers the wider trade-off.
Which Camping Products Drove the Sales?
The Google Ads products report covers Shopping and Performance Max only. It shows how much the core outdoor range outperformed everything else in the catalog.
| Google product category | Products | Cost | Purchases | Purchase value | ROAS |
|---|---|---|---|---|---|
| Sporting Goods | 35 | £10,352.02 | 1,157.71 | £219,114.04 | 21.17 |
| Home and Garden | 11 | £2,382.20 | 204.58 | £19,999.52 | 8.40 |
| Furniture | 3 | £1,065.18 | 105.00 | £9,688.98 | 9.10 |
| No category set | 2 | £381.68 | 47.13 | £3,128.73 | 8.20 |
| Clothing and Accessories | 2 | £132.48 | 22.12 | £1,734.32 | 13.09 |
Sporting Goods took 72 percent of product-level cost and brought in 86 percent of product-level purchase value. Grouped by the store’s own product types, the picture is even clearer:
| Product group | Cost | Purchases | Purchase value | ROAS |
|---|---|---|---|---|
| Tents and tent accessories (3 products) | £4,394.04 | 461.52 | £119,153.00 | 27.12 |
| Sleep systems: quilts and sleeping bags | £3,576.77 | 398.46 | £68,811.45 | 19.24 |
| Sleeping pad bundles | £944.09 | 69.29 | £11,670.22 | 12.36 |
| Camp cookware, including titanium sets and tables | £2,238.60 | 207.14 | £20,231.68 | 9.04 |
| Chairs and sit pads | £949.29 | 90.52 | £7,868.84 | 8.29 |
| Pillows | £594.72 | 68.70 | £6,788.60 | 11.41 |
| Trekking poles | £444.65 | 29.76 | £3,919.49 | 8.81 |
Tents returned about three times more per £1 than cookware, chairs and trekking poles, and sleep systems about twice as much. When one product group earns this much more, it makes sense to give it a campaign and budget of its own, which is what the tents-only Performance Max campaign does.
Product data matters as much as bids here. Category, product type, size and weight in the feed decide which searches a product can show for. Our product feed optimization guide covers the attributes that matter, and the same feed also powers free product listings that bring in organic traffic.
How Did Results Change Month by Month?
Spend and sales both climbed into the summer peak, and the return per £1 fell as spend rose.
| Month (2026) | Cost | Clicks | Purchases | Purchase value | ROAS | Cost per purchase |
|---|---|---|---|---|---|---|
| April | £1,539.69 | 9,231 | 216.75 | £27,959.62 | 18.16 | £7.10 |
| May | £1,554.86 | 9,718 | 209.40 | £29,068.63 | 18.70 | £7.43 |
| June | £1,260.43 | 7,920 | 222.67 | £35,671.53 | 28.30 | £5.66 |
| July | £3,381.39 | 12,970 | 338.91 | £54,803.13 | 16.21 | £9.98 |
| August | £4,628.04 | 14,939 | 396.14 | £70,711.99 | 15.28 | £11.68 |
| September | £3,337.89 | 14,114 | 273.84 | £55,040.93 | 16.49 | £12.19 |
April to June spent £4,355 at a return of 21.29. July to September spent £11,347 at a return of 15.91, and brought in £180,556 of purchase value, almost twice the spring total. As spend went up, each purchase cost more: £11.25 on average from July to September, against £6.71 from April to June.
This is a normal pattern in seasonal retail. A falling ROAS is fine while each extra sale still makes a profit after product cost and shipping. We judge it against the brand’s break-even ROAS, not against the best month. Our explainer on ROAS, break-even ROAS and target ROAS shows how to work that out.
What Did Meta Ads Deliver?
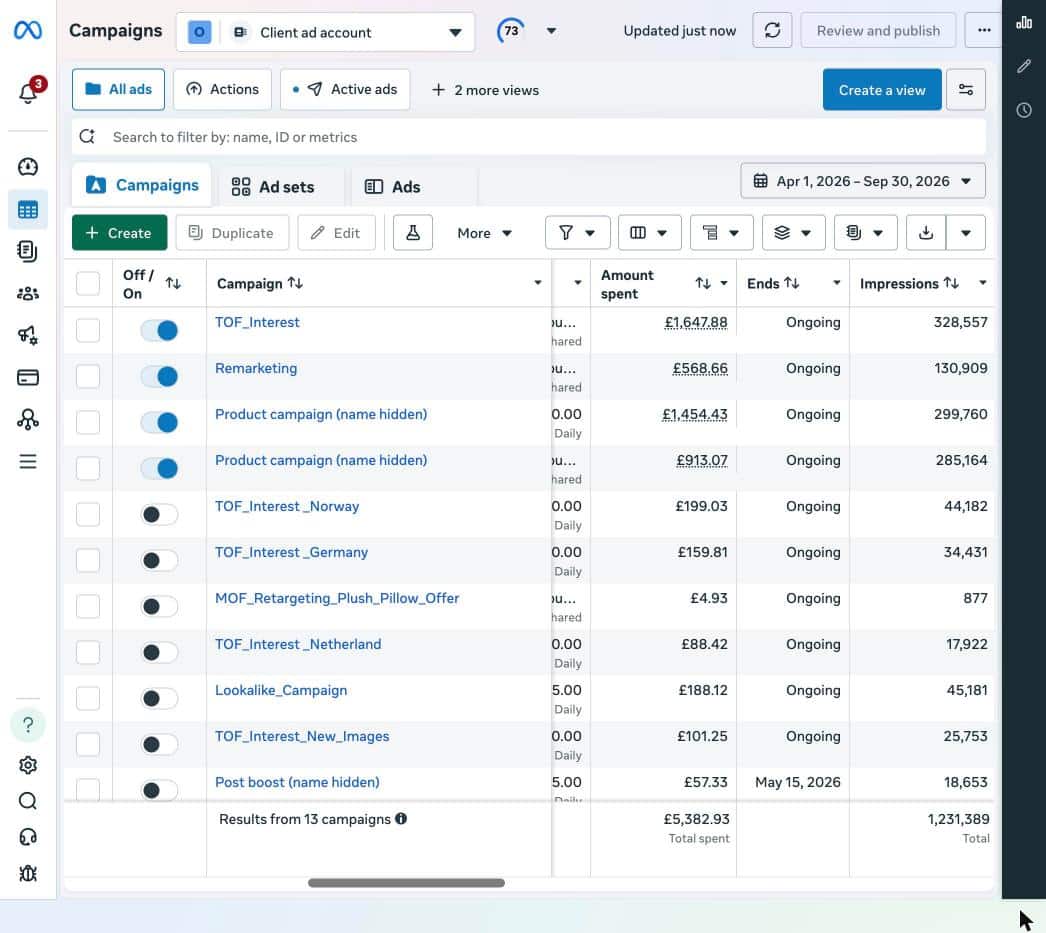
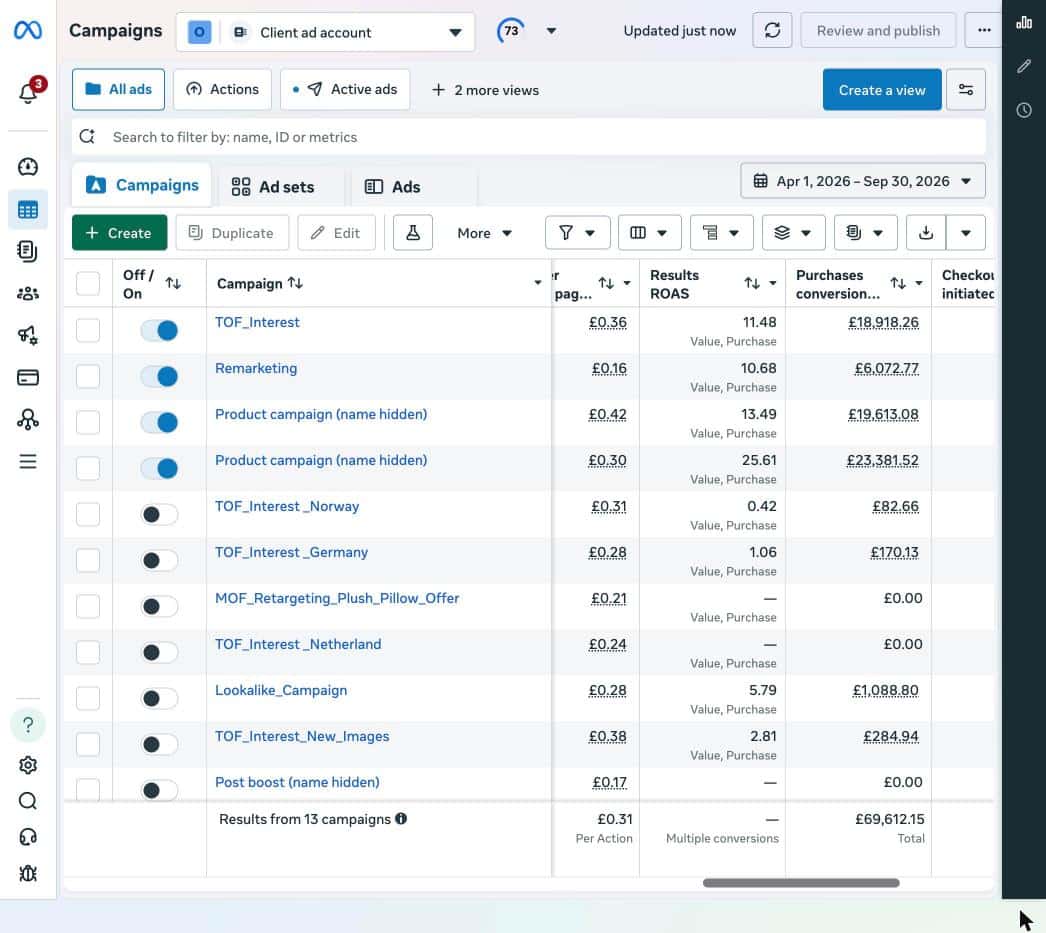
Meta Ads spent £5,382.93 from 1 April to 30 September 2026 and reported £69,612.15 in purchase value, a return of 12.93. Campaigns recorded 411 website purchases at £13.10 each, with 3,877 adds to cart and 1,174 checkouts started.
 Hustle Marketers™
 Hustle Marketers™
| Meta campaign | Amount spent | Purchases | Cost per purchase | Purchase value | ROAS |
|---|---|---|---|---|---|
| Tent product campaign | £913.07 | 109 | £8.38 | £23,381.52 | 25.61 |
| Product video campaign | £1,454.43 | 98 | £14.84 | £19,613.08 | 13.49 |
| Prospecting by interest | £1,647.88 | 111 | £14.85 | £18,918.26 | 11.48 |
| Remarketing | £568.66 | 77 | £7.39 | £6,072.77 | 10.68 |
| Lookalike (now off) | £188.12 | 11 | £17.10 | £1,088.80 | 5.79 |
| Prospecting with new images (now off) | £101.25 | 3 | £33.75 | £284.94 | 2.81 |
| Country tests: Norway, Germany, Netherlands (now off) | £447.26 | 2 | £223.63 | £252.79 | 0.57 |
| Other small campaigns (post boost, mid-funnel offer) | £62.26 | 0 | – | £0.00 | – |
| Total, 13 campaigns | £5,382.93 | 411 | £13.10 | £69,612.15 | 12.93 |
What does the Meta data tell a camping brand?
- A single hero product beat the broad campaigns. The tent campaign returned 25.61 at £8.38 a purchase, the highest return of any Meta campaign in the period.
- Video earns its place. The product video campaign returned 13.49 on the second largest budget.
- Remarketing is cheap but small. It had the lowest cost per purchase, £7.39, but it can only reach people who already visited the store.
- New countries need testing before scaling. The three country tests spent 8 percent of the Meta budget and returned 0.57. Before spending in a new country, check delivery times, shipping costs and pricing for that market.
What Do the Two Channels Look Like Together?
Across both platforms the brand spent £21,085.23 on ads in six months, with Google Ads taking 74.5 percent of it. Google Ads reported £273,255.84 in purchase value and Meta Ads reported £69,612.15.
We do not add those two figures together. Each platform counts its own conversions, and the same order can be claimed by both if a shopper saw a Meta ad and later clicked a Shopping ad. The store’s own sales records are the only total that does not double count. Our guide to why Google, Meta and GA4 report different ROAS explains the gap.
What Do These Numbers Not Show?
These are platform-reported figures for one season, so five things are not in them:
- Profit. Purchase value is revenue as tracked by the ad platforms, not margin. Product cost, shipping, returns and payment fees are not taken off.
- Double counting between platforms. As above, Google and Meta can both claim the same sale.
- Different attribution rules. Google Ads uses data-driven attribution for website purchases, with a 30-day click window, a 3-day engaged-view window and a 1-day view-through window. Meta uses 7-day click, 1-day view or 1-day engagement, which includes some sales from people who saw an ad but did not click it.
- A before and after comparison. This case study covers April to September 2026 only. We do not compare it with the months before.
- The rest of the year. April to September is the main camping season in the UK. Autumn and winter months will look different.
What Did the Client Say?
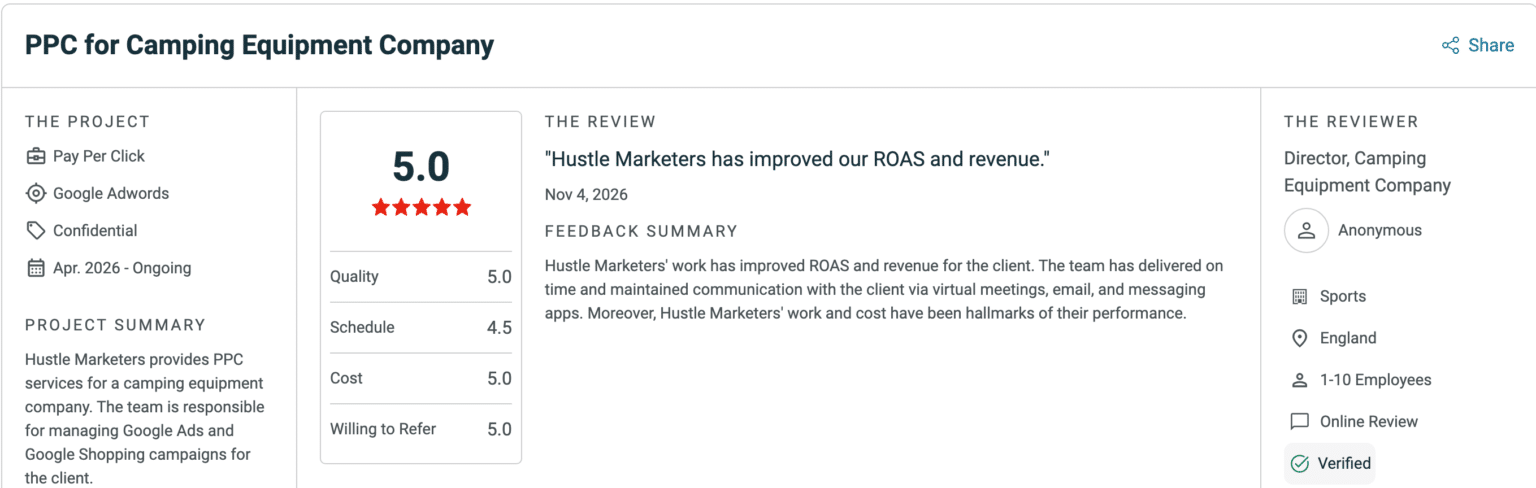
The client left a 5.0 out of 5 review on Clutch on 4 November 2026, titled “PPC for Camping Equipment Company”. They scored Hustle Marketers 5.0 for quality, 4.5 for schedule, 5.0 for cost and 5.0 for willingness to refer. The review is anonymous and verified by Clutch, and lists the project as pay per click and Google Ads, running from April 2026 and ongoing. In the full review, the director says the company supplies lightweight camping equipment, found Hustle Marketers on Upwork and chose us for our high ratings.
 Hustle Marketers™
Hustle Marketers has improved our ROAS and revenue.
Director, camping equipment company, England, 5.0 out of 5 on Clutch
You can read the full review on our Clutch profile.
Why Choose Hustle Marketers or Ishant Sharma for Outdoor and Camping Brands?
This account is run by Ishant Sharma, a Google Ads specialist who has worked in digital marketing since 2013 across Google Ads, Microsoft Ads and SEO. Hustle Marketers is a Google Partner and Meta Business Partner, with Clutch Award wins in 2023, 2024 and 2026. What matters for an outdoor brand:
- We build around your hero products. Tents, sleep systems and other high-value items get their own campaigns and budgets, so they are not starved by slow sellers.
- We plan for the season. Budgets rise into spring and summer and are judged against your break-even ROAS, not against your best month.
- We treat the feed as part of the ads. Categories, product types and specs in Merchant Center decide which searches your products can show for.
- We test new markets small. Here, three country tests on Meta cost £447 in total before they were switched off, instead of a full launch budget.
- You own everything. Your ad accounts stay in your name, and PPC management runs month to month at $600 to $800 per platform with no lock-in.
If you sell outdoor or camping gear, our guide for outdoor and camping gear brands choosing a marketing agency covers costs, ad rules and seasonality in more detail.
Want the same review for your account? Get Free Audit Worth $500
Related Case Studies and Guides
- Outdoor marketing agency guide for camping and outdoor gear brands.
- Ecommerce PPC management, our service for online stores.
- Google Shopping ads agency, how we run Shopping and Performance Max.
- Judaica ecommerce case study, another store where we run Google Ads and Meta Ads together.
- Jewellery Google Ads case study, a new account in its first seven weeks.
- How to improve ROAS, for when the return starts to slip.
Frequently Asked Questions
What is a good ROAS for camping equipment on Google Ads?
A good ROAS is one above your break-even ROAS, which is 1 divided by your profit margin before ads. A brand with a 40 percent margin breaks even at 2.5. This account returned 17.40 across all campaigns from April to September 2026, but your target should come from your own margins.
Should a camping brand use Google Shopping or Performance Max?
Both can work, and this account uses both. Standard Shopping returned 17.46 and gives clear control over products and search terms. Performance Max returned 18.37 when it ran on selected product groups, including a tents-only campaign. Running one Performance Max campaign across the whole catalog gives you less control over which products get the budget.
When should outdoor brands spend most on ads?
In this UK account, clicks rose from 9,231 in April to 14,939 in August, and purchase value peaked in August at £70,712. Spring and summer are the main season for camping gear in the UK. Raise budgets before the peak, not during it, so campaigns have data when demand arrives.
Do Facebook and Instagram ads work for camping gear?
They did here. Meta Ads returned 12.93 on £5,383 of spend from April to September 2026. A single tent campaign did best at 25.61, and a product video campaign returned 13.49. Meta reports use 7-day click, 1-day view or 1-day engagement attribution, so compare them with your store’s sales.
Why are the Google Ads and Meta ROAS figures not added together?
Because each platform counts its own conversions, and the same order can be claimed by both. A shopper might see a Meta ad and later click a Shopping ad. Adding the two figures would count that sale twice, so the store’s own sales records are the reliable total.
How much does PPC management cost for an outdoor brand?
Hustle Marketers charges $600 to $800 per platform a month for PPC management, month to month with no lock-in. Your ad spend is separate and goes to Google or Meta directly, and your ad accounts stay in your name.
Why is the client not named?
Our client work is covered by signed NDAs, so we share results without naming the brand or its products. The figures come from the live ad accounts, the product campaign names are hidden in the screenshots, and the client’s own review is on Clutch.