Identity Services Google Ads Case Study: Fixing Inflated Conversions

Ishant
Published : November 5, 2026 at 4:53 pm
Updated : November 5, 2026 at 6:10 pm
Ishant
By Ishant Sharma, a Google Ads specialist working in digital marketing since 2013 and founder of Hustle Marketers™. Published 5 November 2026. All account figures were read from the live Google Ads account on 5 November 2026 and are in Australian dollars.
This Google Ads case study covers an Australian identity services company with 1 to 10 staff that takes customer applications through its website. The business has advertised on Google since December 2015, and Hustle Marketers has worked on its Google Ads since January 2026, the start date on the client’s Clutch review. That review is anonymous, so we do not name the company here either.
The short version: from 1 August to 31 October 2026, the account delivered 799.83 completed applications on A$15,477.42 of ad spend, about A$19.35 per completed application, or roughly one for every seven clicks.
We also fixed the numbers that Smart Bidding learns from. In October we found the account reported 1,859.05 conversions at A$2.53 each, but only 161.07 were completed applications. Most of the rest, 1,669.98, were GA4 form submissions counted every time a form was sent. On 30 October 2026 we took form submissions out of the Conversions column, so bidding now learns from real applications.
On this page: the results, why conversions beat clicks, how we found it, what we changed, the Smart Bidding impact, the tracking timeline, the Search clean-up, what the numbers do not show, the client review and FAQs.
Key Observations
- From August to October 2026 the account delivered 799.83 completed applications at about A$19.35 each, from 5,461 clicks: roughly one completed application for every seven clicks.
- The same three months also brought in 65 renewal starts and 20 calls from ads.
- In October 2026 the account reported 1,859.05 conversions from 1,801 clicks, at A$2.53 per conversion on A$4,705.70 of spend.
- GA4 form_submit made up 1,669.98 of those conversions, about 90 per cent. It was a primary conversion set to count every submission.
- The application Search campaign showed a conversion rate of 192.63 per cent, almost two conversions for every click.
- Completed applications were 161.07, so the real cost was A$29.22 per completed application: A$24.61 in Performance Max, A$25.34 in Brand and A$34.49 in the application campaign.
- All three campaigns bid towards the lead goal that held form_submit. Two use Target CPA and one uses Maximise conversions, so the inflated conversions were feeding Smart Bidding, not only the report.
- On 30 October 2026 we set form_submit to secondary and took it out of the Conversions column. Bidding now learns from completed applications, renewal starts and, in the Brand campaign, calls.
- In September we also cleaned up the Search side: a keyword built on another provider’s name removed, two broad match keywords paused, and 18 phrase match negatives added to the account-level list.
- The client rated Hustle Marketers 5.0 out of 5 on Clutch and named our responsiveness as what impressed them most.
Identity Services Google Ads Case Study at a Glance
This identity services account has advertised on Google since December 2015 and runs three campaigns on Smart Bidding. From August to October 2026 it delivered 799.83 completed applications at about A$19.35 each, and in October completed applications cost A$29.22 each.
| Item | Detail |
|---|---|
| Client | An Australian identity services company with 1 to 10 staff (from its Clutch review) |
| Completed applications, August to October 2026 | 799.83 at about A$19.35 each, on A$15,477.42 of spend |
| Advertising on Google since | December 2015 |
| Hustle Marketers since | January 2026 (from its Clutch review) |
| Campaigns | Application Search, Performance Max and Brand Search |
| Bidding (as set on 5 November 2026) | Target CPA on both Search campaigns, Maximise conversions on Performance Max |
| Daily budgets today | A$125 application Search, A$60 Performance Max, A$15 Brand |
| October 2026 spend | A$4,705.70 from 1,801 clicks |
| Reported cost per conversion, October 2026 | A$2.53 |
| Cost per completed application, October 2026 | A$29.22 |
| Main fix | GA4 form_submit set to secondary on 30 October 2026 |
| Clutch rating | 5.0 out of 5, review dated 18 September 2026 |
What Did Google Ads Deliver From August to October 2026?
From 1 August to 31 October 2026, the account delivered 799.83 completed applications on A$15,477.42 of ad spend, about A$19.35 per completed application. That came from 5,461 clicks, so roughly one in every seven clicks turned into a completed application. The same three months also brought in 65 renewal starts and 20 calls from ads.
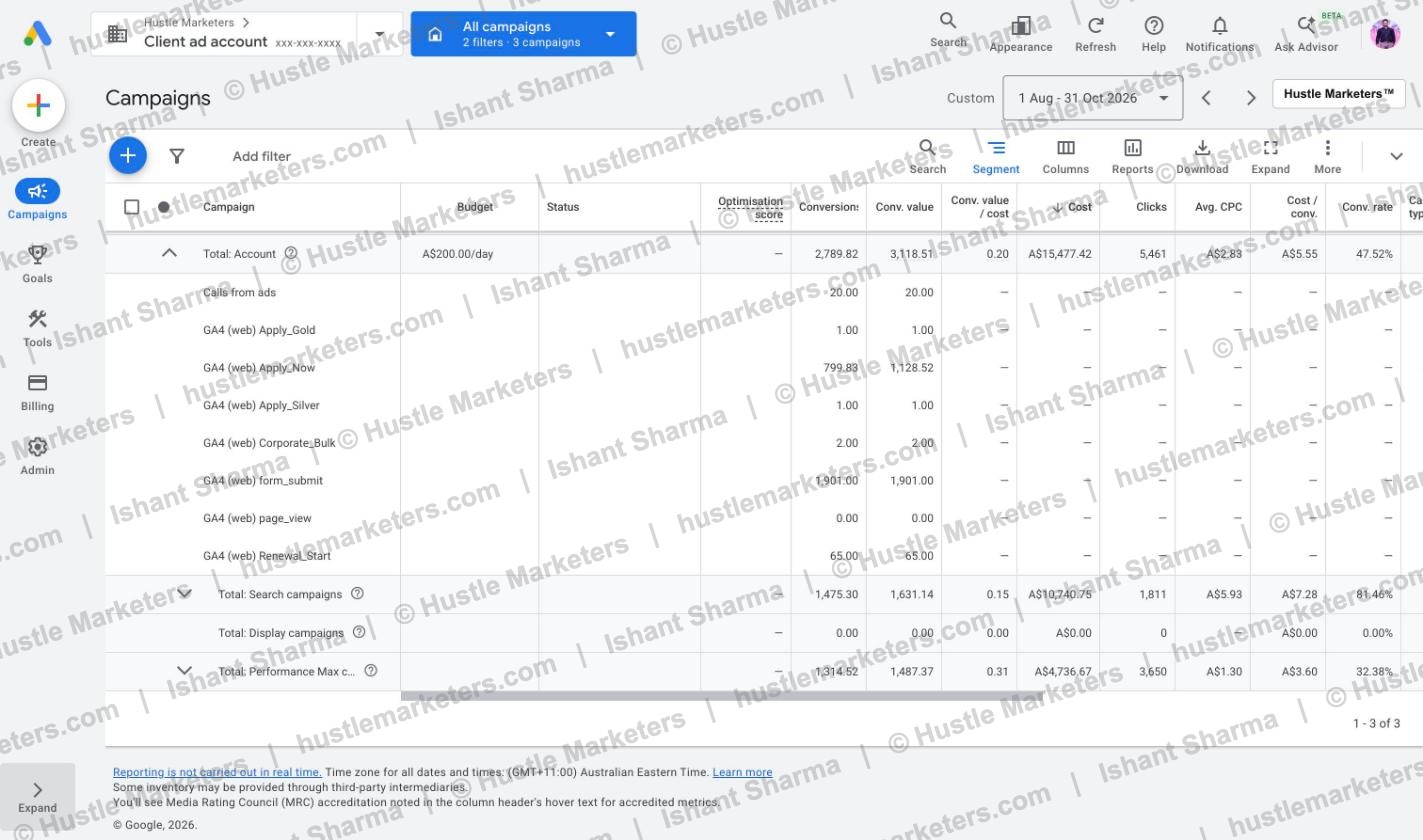
| Result, 1 August to 31 October 2026 | Figure |
|---|---|
| Completed applications (GA4 Apply_Now) | 799.83 |
| Ad spend | A$15,477.42 |
| Cost per completed application | About A$19.35 |
| Clicks | 5,461 |
| Completed applications per click | About 1 in 7 |
| Renewal starts | 65 |
| Calls from ads | 20 |
Why Did Google Ads Report More Conversions Than Clicks?
Because one conversion action, GA4 form_submit, was primary and set to count every submission. In October 2026 it recorded 1,669.98 conversions on its own, close to the 1,801 clicks the whole account received. Primary actions fill the Conversions column, so these submissions sat next to completed applications and made every result look cheaper.
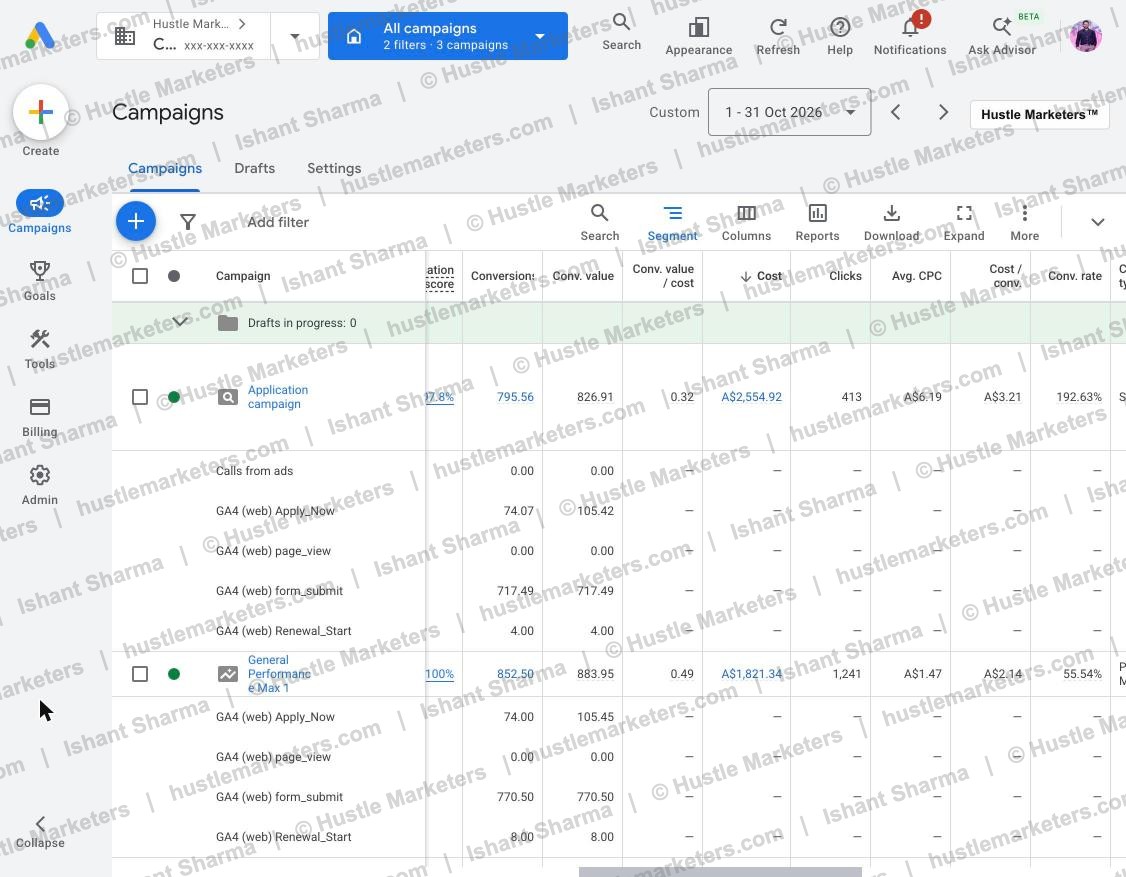
Here is October 2026 by campaign, with reported conversions next to completed applications:
| Campaign | Clicks | Cost | Reported conversions | Of which form_submit | Completed applications | Reported cost per conversion | Cost per completed application |
|---|---|---|---|---|---|---|---|
| Application Search | 413 | A$2,554.92 | 795.56 | 717.49 | 74.07 | A$3.21 | A$34.49 |
| Performance Max | 1,241 | A$1,821.34 | 852.50 | 770.50 | 74.00 | A$2.14 | A$24.61 |
| Brand Search | 147 | A$329.45 | 210.99 | 181.99 | 13.00 | A$1.56 | A$25.34 |
| Account total | 1,801 | A$4,705.70 | 1,859.05 | 1,669.98 | 161.07 | A$2.53 | A$29.22 |
Campaign costs are rounded, so they add to A$4,705.71. Reported conversions also include 15 renewal starts and 13 calls from ads, and the decimals come from how Google Ads attributes conversions across ad interactions.
Without form_submit, October would have shown 189.07 conversions at A$24.89 each. Counting completed applications alone, the cost was A$29.22 per application.
How can conversions be higher than clicks?
Conversions can be higher than clicks when one click leads to more than one counted action. Each conversion action in Google Ads counts either One conversion per click or Every conversion after a click. With Every, a visitor who sends three forms adds three conversions.
Google says that if you track more than one action, or count every conversion, your conversion rate “might be over 100%”. Source: Google Ads Help on conversion rate.
Google recommends One for leads, because one lead per click is usually what adds value, and Every for sales. Every is the default for website conversions, so it is worth checking on any lead account. Source: Google Ads Help on conversion counting options.
How Did We Find the Inflated Conversions?
We split the Conversions column by conversion action after the application campaign’s conversion rate passed 100 per cent and form submissions far outnumbered completed applications. Read on 5 November, October shows form_submit at 1,669.98 conversions, about 90 per cent of the month’s total, against 174.01 in September. Completed applications stayed in the same range: 146 in September and 161.07 in October.
This is the check we run on lead accounts, in this order:
- Compare conversions with clicks for each campaign. A conversion rate above 100 per cent on a lead campaign is a tracking question before it is a result.
- Segment by conversion action. In Google Ads, open Campaigns, select Segment, then Conversions, then Conversion action. Each campaign then shows one row per action.
- Open the conversion actions list under Goals and check each primary action: where it comes from, whether it counts One or Every, and whether it is primary or secondary.
- Read the change history for conversion actions, so you know the date the problem started.
- Make the fix as a single change, so the date is clear in the change history and any shift in the numbers afterwards is easy to trace.
What Did We Change on 30 October 2026?
We changed one conversion action. On 30 October 2026 at 5:59 pm (GMT+11:00, the account’s time zone), we set GA4 form_submit to Secondary action (observe only) and changed its Include in Conversions setting to No. Form submissions still show in All conversions, so nothing is lost from reporting, but they no longer count in the Conversions column that bidding uses.
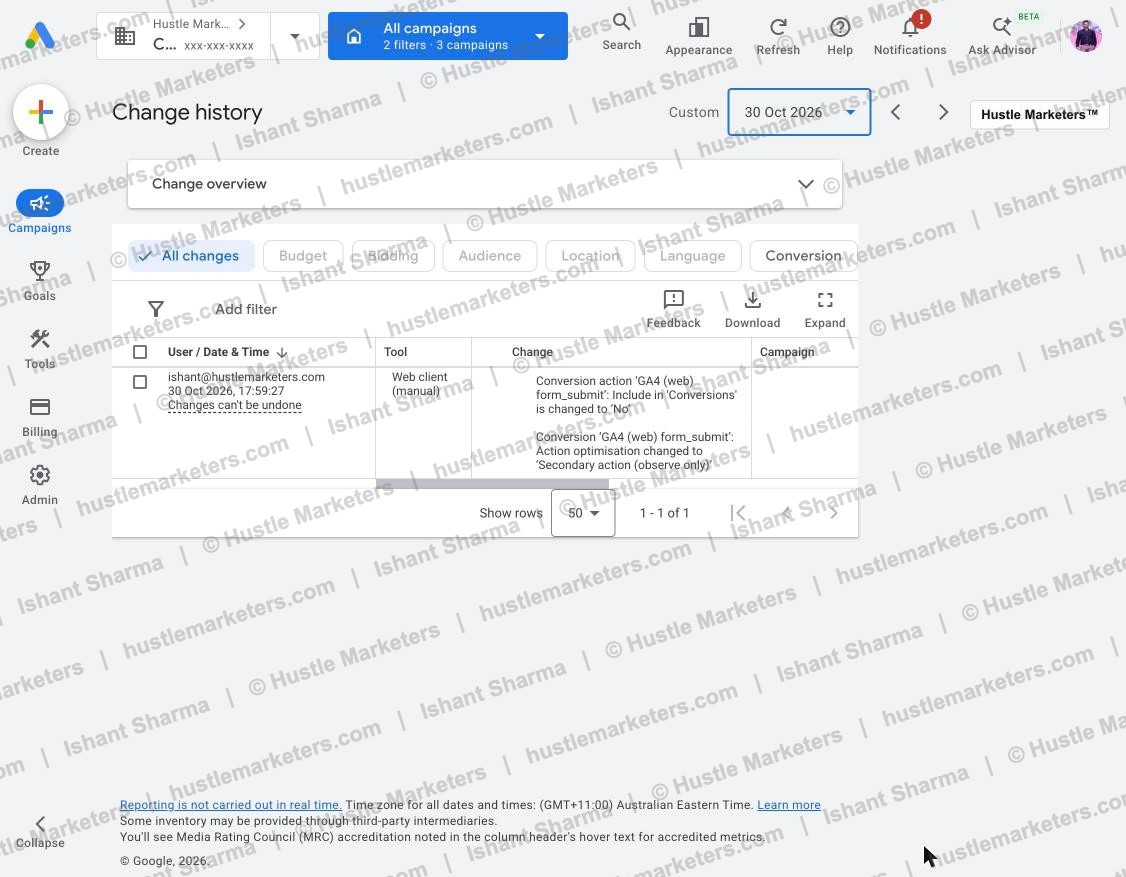
After the change, the Conversions column counts:
- GA4 Apply_Now, a completed application, counted once per click.
- GA4 Renewal_Start, a renewal start, counted once per click.
- Four other application and enquiry events, counted once per click, which show the status Awaiting conversions.
- Calls from ads, which the Brand campaign bids on alongside lead forms.
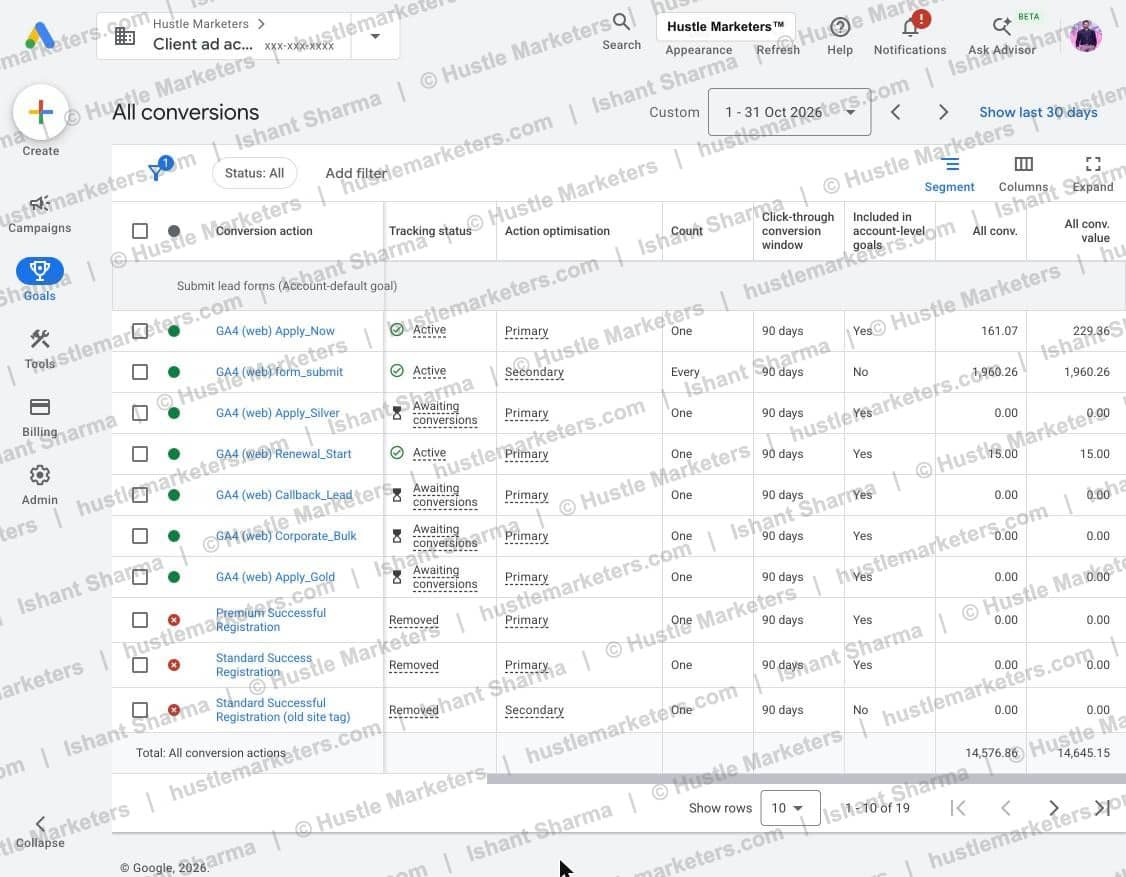
Should form submissions be a primary conversion?
Not when a better signal is tracked. Google sets conversions created from Google Analytics to secondary by default, and says GA4 key event conversions are set to secondary “to prevent counting the same event twice for bidding”. A generic form submission event can record forms that are not finished applications, so we keep the completed application as primary and leave form_submit as secondary, where it still shows in All conversions. Source: Google Ads Help on GA4 key event conversions.
Google also explains that primary actions are used for bidding when the campaign uses their goal, while secondary actions are for observation only, unless they sit in a custom goal. Source: Google Ads Help on primary and secondary conversion actions.
Why Does This Matter for Smart Bidding?
Because Smart Bidding learns from the Conversions column. Google says it “will learn across all conversion actions” reported there, so whatever sits in that column shapes how much each campaign bids for every search. Source: Google Ads Help on Target CPA bidding.
In this account, both Search campaigns bid with Target CPA and Performance Max bids with Maximise conversions (settings as read on 5 November), all towards the lead form goal that held form_submit. So the cheap form submissions were part of what all three campaigns were learning from.
Google describes a standard 7 to 14 day learning phase for Smart Bidding and says frequent changes to budgets, targets or goals during that time can restart learning. Less than a week after the change, it is too early to judge the effect of the fix, so the results on this page cover August to October 2026. For more on how each strategy uses conversions, see our guide to Google Ads bidding strategies.
How Was the Tracking Set Up Before the Fix?
In the first half of 2026 the account counted mainly calls from ads and an older website registration tag. In late July 2026 its conversions moved to GA4 events, and from 24 July form_submit counted as a primary conversion on every submission. The table shows each dated step, taken from the account’s change history.
| Date | What changed in the account |
|---|---|
| 24 July 2026 | GA4 form_submit set to primary and included in Conversions, counting Every. GA4 page_view set to secondary. |
| 25 July 2026 | GA4 application events set to count One. |
| 27 July 2026 | GA4 Apply_Now and the other application events set to primary. |
| October 2026 | form_submit records 1,669.98 conversions, against 161.07 completed applications. |
| 30 October 2026 | form_submit set to secondary and taken out of Conversions. |
The older registration tags now show as removed in the conversion actions list. Our records do not show when they were removed.
What Else Did We Clean Up in the Search Campaigns?
In September 2026 we tightened which searches the ads reach. We removed a keyword built on another provider’s name, paused two broad match keywords, and on 16 September added 18 phrase match negatives to the account-level negative keyword list, plus 3 exact match negatives. Budgets also changed twice during the month.
| Date | What changed |
|---|---|
| 2 September 2026 | Keyword built on another provider’s name removed. Performance Max paused. Brand exact match ad group paused. Application campaign budget lowered, Brand budget raised. |
| 15 September 2026 | Two broad match keywords paused. |
| 16 September 2026 | 18 phrase match negatives added to the account-level list, plus 3 exact match negatives. |
| 18 September 2026 | Performance Max turned back on. |
| 23 September 2026 | Two ad group Target CPAs lowered. Application campaign budget raised, Performance Max budget lowered. |
| 28 September 2026 | Two ad groups removed. |
| 29 September 2026 | Performance Max asset group and campaign changes, including new assets. |
Why put negative keywords at account level?
Because one list then covers Search and Performance Max together. The 18 phrase negatives block off-target searches, such as job hunting, courses and other providers’ brand names. We do not list the terms here because they would identify the client’s niche.
Google allows up to 1,000 negative keywords at account level, applies them to search and shopping inventory in Search, Performance Max and several other campaign types, and says they do not match close variants. Source: Google Ads Help on account-level negative keywords. Our Google Ads negative keywords guide covers match types and limits in more detail.
What Do These Numbers Not Show?
They do not show results after the fix, the client’s back-end application numbers, final figures for recent months, or fair comparisons across 2026. These are Google Ads figures read on 5 November 2026, and each limit is explained below:
- Results after the fix. We made the change on 30 October 2026, so on 5 November the account was still inside the 7 to 14 day learning period Google describes, and we make no before and after claim yet.
- Back-end application numbers. Completed applications here are GA4 Apply_Now events reported in Google Ads. We have not matched them against the client’s own records, and GA4 can differ from a back-end system.
- Final October figures. Google Ads reports conversions on the ad impression date, not the day the conversion happened, and conversions can be reported up to 90 days after the click, so recent months can still change. Source: Google Ads Help on data discrepancies.
- A typical September. Performance Max stayed paused from 2 to 18 September and budgets changed twice, so September is not a clean month to compare with.
- Fair comparisons across 2026. What counted as a conversion changed during the year, as the table below shows.
| Period | Reported cost per conversion | What counted as a conversion |
|---|---|---|
| January to March 2026 | A$68.13 | Mainly calls from ads and an older registration tag |
| April to June 2026 | A$75.54 | Mainly calls from ads and an older registration tag |
| July to September 2026 | A$11.72 | Mainly GA4 completed applications and form_submit, plus calls and renewal starts |
| October 2026 | A$2.53 | Mostly form_submit, counted every time |
On paper, cost per conversion fell from A$75.54 to A$2.53. That fall comes from changes in what was counted, so it says nothing about results, and we do not claim any part of it as one. The strongest next check is matching Google Ads to the client’s own application records, which our guide to Google Ads CRM tracking explains.
What Did the Client Say?
The client left a 5.0 out of 5 review on Clutch, dated 18 September 2026. An accountant at the company wrote it and scored Hustle Marketers 4.5 for quality, 4.5 for schedule, 5.0 for cost and 5.0 for willingness to refer. Clutch shows the review as anonymous, lists the business as an Australian information technology company with 1 to 10 employees, and gives the project as January 2026 to ongoing.

I was impressed with their responsiveness.
Accountant, IT Company, Australia, anonymous Clutch review, 5.0 out of 5
The review also says the client found us through an online search, chose us for our high ratings, and worked with one Hustle Marketers team member over virtual meetings. You can read it on our Clutch profile.
Why Choose Hustle Marketers or Ishant Sharma for Google Ads Conversion Tracking?
This account is run by Ishant Sharma, a Google Ads consultant who has worked in digital marketing since 2013 across Google Ads, Microsoft Ads and SEO. Hustle Marketers is a Google Partner and Meta Business Partner, with Clutch Award wins in 2023, 2024, and 2026. We work as a PPC agency and Google Ads agency for businesses in Australia and other markets, with our delivery team in Zirakpur, India. What we bring to a lead generation account:
- We read conversions by action, not only the total. On this account, that split is what found the problem.
- We show both numbers. Reported cost per conversion and cost per completed application sit side by side, as on this page.
- We keep negative keywords at account level where they should apply everywhere, grouped by theme.
- You own everything. Your ad accounts stay in your name, and PPC management runs month to month at US$600 to US$800 per platform, about A$860 to A$1,150 at the Reserve Bank of Australia rate on 4 November 2026, with no lock-in. You pay ad spend separately.
Our Google Ads conversion tracking guide covers setup, settings and troubleshooting in more detail.
Comparing Google Ads help in Australia? Our guides cover the best Google Ads agencies in Australia, local options in Perth, Sydney, Brisbane and Melbourne, and what to look for when you hire a Google Ads consultant in Perth.
Want the same check on your account? Get Free Audit Worth $500
Related Case Studies and Guides
- Google Ads agency services, how we run Search, Performance Max and tracking.
- PPC agency services across Google Ads, Microsoft Ads and Meta Ads.
- Google Ads management in Brisbane, Sydney and Perth compared.
- How much to spend on Google Ads, for setting a budget.
- Google Ads conversion tracking guide, for setup, settings and troubleshooting.
- Google Ads bidding strategies, including how Target CPA uses your conversions.
- Google Ads CRM tracking, for finding which leads become customers.
- Google Ads spam leads, for finding the source of fake leads.
- Google Ads audit checklist, the checks we run on a new account.
- Brisbane commercial cleaning equipment case study, another Australian Google Ads account.
- Camping equipment PPC case study, a UK brand where we run Google Ads and Meta Ads.
Frequently Asked Questions
Why is my Google Ads conversion rate over 100%?
Because more than one conversion is being counted per click. Google says this can happen when you track more than one conversion action or count every conversion. In this account, form submissions counting Every pushed the application campaign to 192.63 per cent. Segment by conversion action to see which one is responsible.
Should form submissions be a primary conversion in Google Ads?
Only if a form submission is the outcome you want more of and nothing better is tracked. If a completed application, booking or purchase is tracked, make that primary and keep form_submit secondary. Secondary actions still show in All conversions but are not used for bidding, unless they sit in a custom goal.
Should lead conversions count One or Every?
One, in most cases. Google recommends One for leads, because one lead per click is usually what adds value, and Every for sales. Every is the default for website conversions, so check it. If your GA4 link uses paid and organic channels attribution, Google says the count is managed in Google Analytics instead.
How do I find which conversion action is inflating my numbers?
In Google Ads, open Campaigns, select Segment, then Conversions, then Conversion action. Each campaign then shows one row per action. Look for an action with more conversions than the campaign has clicks, then open it under Goals to check its source, its count setting and whether it is primary.
Does changing a conversion action to secondary reset Smart Bidding?
It changes what Smart Bidding learns from, so expect a settling period. Google describes a standard 7 to 14 day learning phase and says frequent changes to budgets, targets or goals during it can restart learning. Make the change once, note the date, and judge results on the new numbers after that period.
Why is the client not named in this case study?
The client’s Clutch review is anonymous, so we keep the case study anonymous too. Every figure comes from the client’s live Google Ads account. We hid the account name and one campaign name in the screenshots.
How much does Google Ads management cost with Hustle Marketers in Australia?
PPC management is US$600 to US$800 per platform per month, about A$860 to A$1,150 at the Reserve Bank of Australia rate on 4 November 2026. It runs month to month with no lock-in, you pay ad spend separately, and the ad accounts stay in your name.