PPC Statistics 2026: Verified Numbers for Google Ads, Microsoft Ads and AI Search

Ishant
Published : October 26, 2026 at 3:53 pm
Updated : October 28, 2026 at 2:50 pm
Ishant

PPC statistics for 2026 show a bigger and more expensive market. US search ad revenue reached $114.2 billion in 2025, up 11% (IAB/PwC). The median Google Ads click costs $5.42 in WordStream’s study of 13,474 US campaigns. In the 44 US businesses we manage, the median Google Search click cost $3.18, and the same businesses paid a median 17% more per click than a year earlier (Hustle Marketers data).
Summarize this article with:
Key Observations
- The median Google Search click cost $3.18 across 44 US businesses we manage, with a 7.73% CTR and a 7.42% conversion rate (Hustle Marketers data, 11 Sep 2025 to 10 Sep 2026).
- Home services and construction businesses paid a median $9.72 per Google Search click, six times the $1.63 paid by ecommerce stores (Hustle Marketers data, 2025 to 2026).
- Google Search CPC rose in 19 of 30 US businesses we managed in both years, a median rise of 17% (Hustle Marketers data, September 2024 to September 2026).
- Performance Max took 48% of Google Ads spend across 75 businesses we manage, and 56% of spend in ecommerce (Hustle Marketers data, 2025 to 2026).
- Brand Search returned a median 16.44x ROAS against 3.09x for non-brand Search in ecommerce accounts, in our 22-account benchmark paper published on Zenodo (Hustle Marketers research, October 2026).
- Fewer than a third of Microsoft Ads clicks (85,810 of 281,296) were bought on Microsoft Sites and Select Traffic, across eight accounts we manage (Hustle Marketers study, September 2025 to September 2026).
- 15 of 21 top-ranking PPC statistics pages repeat Google’s “$2 for every $1” modeling assumption as if it were a measured return (Hustle Marketers audit, October 2026).
- US search ad revenue was $114.2 billion in 2025, up 11.0% (IAB/PwC, April 2026).
- Google Search and other revenue was $224.5 billion in 2025, up 13.4% from $198.1 billion (Alphabet 10-K, February 2026).
- The median Google Ads cost per click is $5.42, up 3.0% from $5.26 a year earlier (WordStream, updated September 2026; change is our calculation).
- The median Google Ads click-through rate is 6.64% and the median conversion rate is 8.18% (WordStream, updated September 2026).
- The median cost per lead fell to $66.69, the first drop in five years (WordStream, updated September 2026).
- In February 2026, paid CTR was 16.2% on queries with an AI Overview and 21.8% on queries without one, across 53 brands (Seer Interactive, April 2026).
- 68.01% of US Google searches in desktop and mobile browsers ended without a click, January to April 2026, excluding the Google app (SparkToro, June 2026).
- Meta’s average price per ad rose 14% year over year in Q3 2026, while ad impressions grew 10% (Meta Q3 2026 results, October 2026).
Free to use and cite
Use any statistic on this page. For third-party figures, credit the original source named next to each one. For figures marked Hustle Marketers data, credit Hustle Marketers and link to this page: PPC Statistics 2026, Hustle Marketers.
Every figure and table on this page is also in our free PPC statistics dataset on Google Sheets, with the source link for each row. Our own Google Ads figures are also in a separate benchmarks sheet.
How does your account compare with these benchmarks? We check your CPC, conversion rate, cost per lead and wasted spend against your industry, and show you where the gaps are. Get Free Audit Worth $500
What does our own Google Ads data show for 2026?
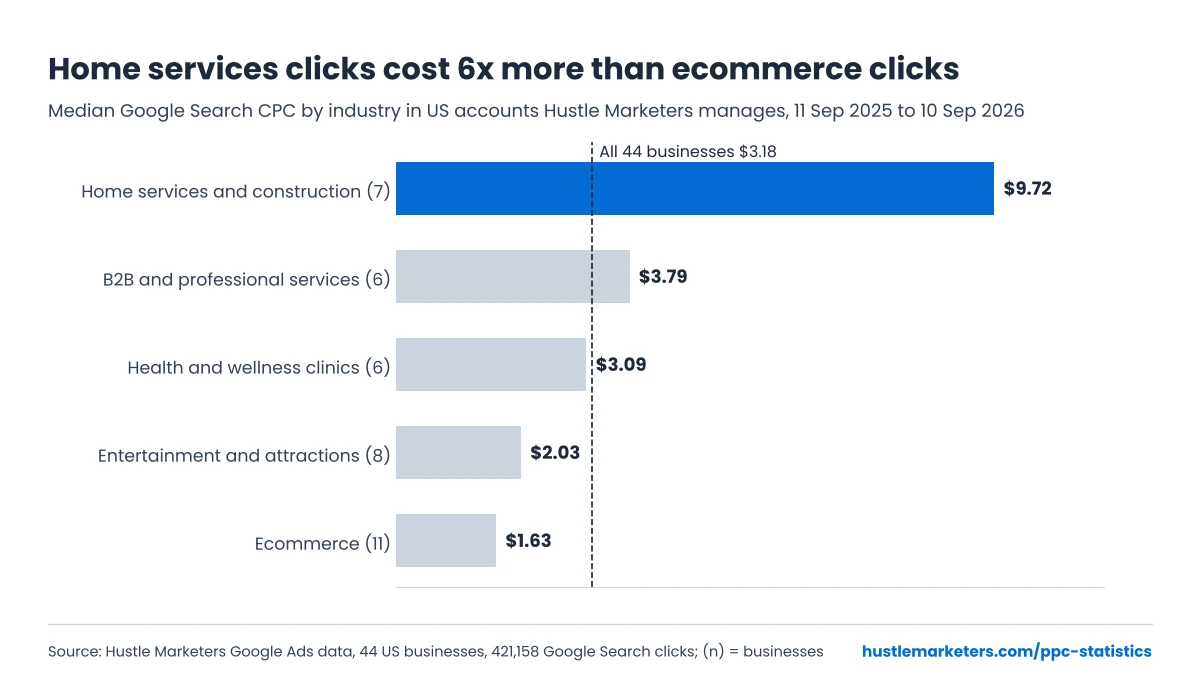
Across 44 US businesses we manage, the median Google Search click cost $3.18 from 11 September 2025 to 10 September 2026. The median click-through rate was 7.73% and the median conversion rate 7.42%. Home services paid $9.72 a click, six times the $1.63 paid by ecommerce stores.
This is first-party data from 52 Google Ads accounts and 421,158 Google Search clicks. It covers Search campaigns on the Google Search network only. Each business counts once, so one large account cannot pull the median up or down.
Prefer to watch? This four-minute video walks through the same 421,158 clicks: median CPC, CTR and conversion rate, the Performance Max spending share, and how our sample compares with WordStream’s wider US benchmarks.
| Industry (US businesses) | Businesses | Median CPC | Middle 50% of CPCs | Median CTR | Median conversion rate |
|---|---|---|---|---|---|
| Ecommerce | 11 | $1.63 | $1.11 to $2.55 | 12.72% | 5.39% |
| Entertainment and attractions | 8 | $2.03 | $0.81 to $3.33 | 9.55% | 8.95% |
| Health and wellness clinics | 6 | $3.09 | $2.14 to $6.00 | 5.16% | Not shown (fewer than 5 comparable accounts) |
| B2B and professional services | 6 | $3.79 | $3.13 to $4.28 | 6.82% | 9.57% |
| Home services and construction | 7 | $9.72 | $8.39 to $12.23 | 4.03% | 6.36% |
| All 44 US businesses | 44 | $3.18 | $1.57 to $6.09 | 7.73% | 7.42% |
Source: Hustle Marketers Google Ads data, Search campaigns on the Google Search network, 11 September 2025 to 10 September 2026. The all-businesses row also includes 6 businesses in education, restaurants and nonprofit work, groups too small to show on their own.
Want these numbers in a spreadsheet? Open our free Google Ads Benchmarks 2026 sheet, with every industry median, the year-over-year change and the spend split by campaign type.
How do our numbers compare with WordStream’s 2026 benchmarks?
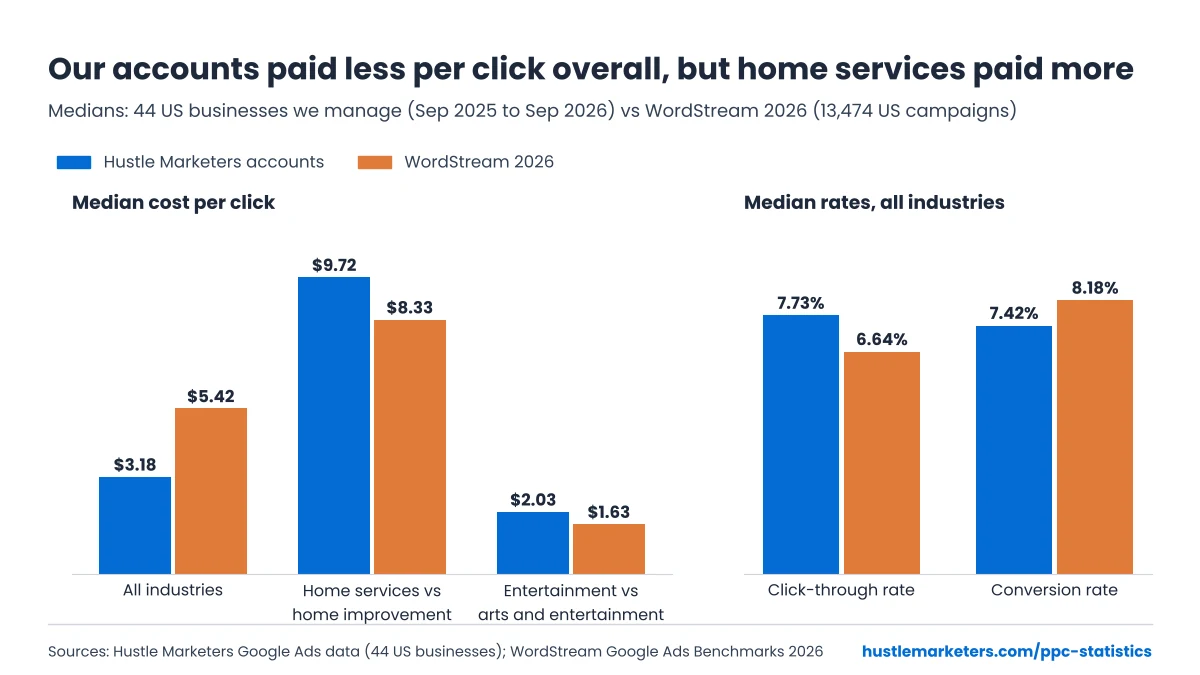
Our overall median CPC is lower than WordStream’s, but our local trades pay more. Our sample leans toward ecommerce stores and attractions, where many clicks come from people searching the brand name, and brand clicks are cheap. Home services sits above WordStream’s figure for home and home improvement.
| Metric | Our median (US businesses we manage) | WordStream 2026 median |
|---|---|---|
| Cost per click, all industries | $3.18 (44 businesses) | $5.42 |
| Click-through rate, all industries | 7.73% | 6.64% |
| Conversion rate, all industries | 7.42% (41 businesses) | 8.18% |
| Cost per click, home services vs home and home improvement | $9.72 | $8.33 |
| Cost per click, entertainment and attractions vs arts and entertainment | $2.03 | $1.63 |
WordStream figures are from its 2026 Google Ads benchmarks, 13,474 US search campaigns, April 2025 to March 2026. The industry labels do not match one to one, so read the last two rows as a rough check.
Did Google Ads CPCs rise in the accounts we manage?
Yes, in most of them. Among 30 US businesses we managed in both periods, Google Search CPC rose in 19 and fell in 11. The median change was a 17% rise, from $2.27 to $3.04 a click, comparing 11 September 2024 to 10 September 2025 with the following 12 months.
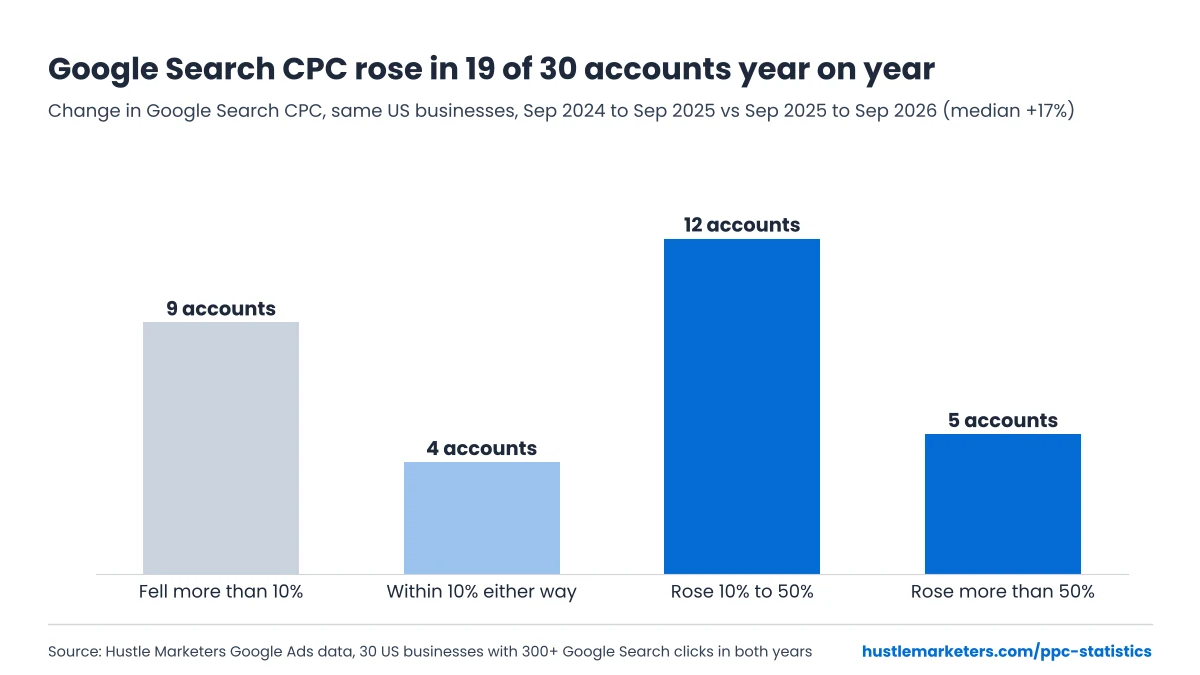
Pooled across all 30, spend rose 9.6% and clicks 3.8%, so the average click cost 5.5% more. Read this as account-level change, not a pure auction price index. Our own work moves CPC too: new campaigns, match type changes, bid strategy changes and the share of brand searches. Five businesses saw CPC rise by more than 50%, and nine saw it fall by more than 10%.
How much Google Ads spend goes to Performance Max?
Performance Max took 48.2% of Google Ads spend across the 75 businesses we manage, against 40.8% for Search and 9.0% for standard Shopping, from 11 September 2025 to 10 September 2026. In ecommerce, Performance Max took 55.7% of spend, Search 27.0% and Shopping 16.0%.
| Campaign type | Share of spend, all 75 businesses | Share of spend, 31 ecommerce businesses |
|---|---|---|
| Performance Max | 48.2% | 55.7% |
| Search | 40.8% | 27.0% |
| Standard Shopping | 9.0% | 16.0% |
| Demand Gen | 1.4% | 1.1% |
| Other (Smart, App, Video, Display) | 0.7% | 0.2% |
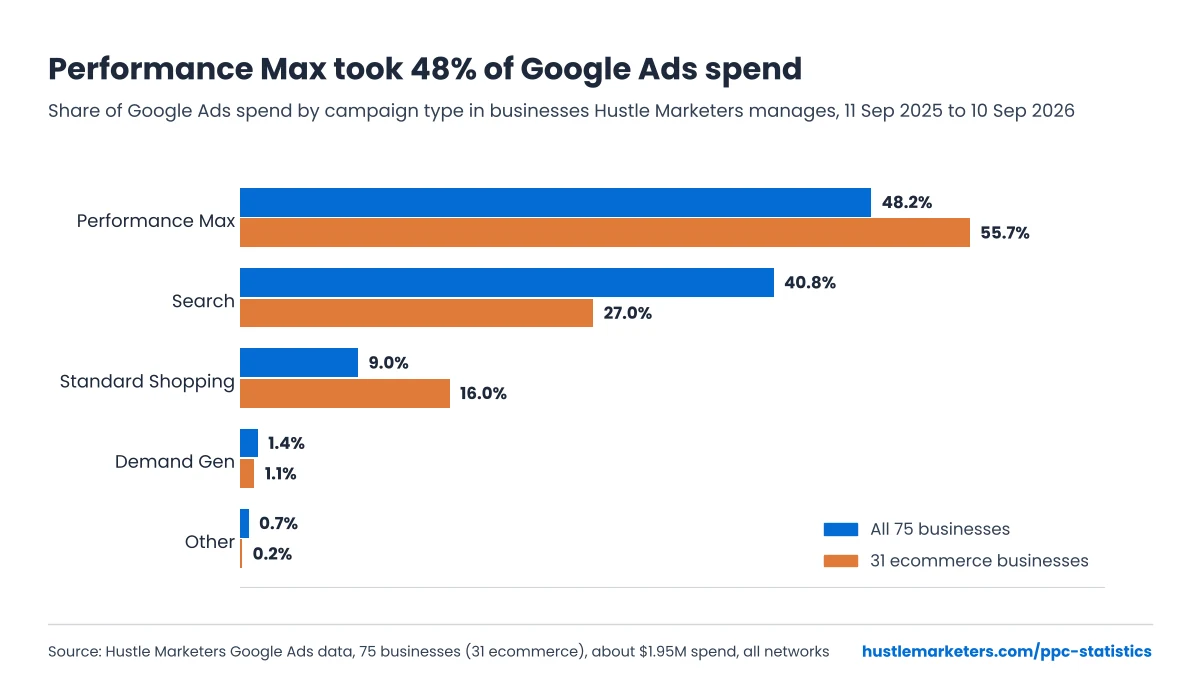
The spend covers about $1.95 million across all markets, converted to US dollars with Google’s own currency conversion. Shares may not add to exactly 100% because of rounding.
What ROAS does each Google Ads campaign type return?
In a separate 22-account study we published on Zenodo, brand Search returned a median 16.44x ROAS for ecommerce accounts, more than five times the 3.09x from non-brand Search. Standard Shopping (5.62x) and Performance Max (4.95x) sat in between.
| Campaign type (ecommerce) | Median ROAS | Middle 50% of accounts | Accounts |
|---|---|---|---|
| Brand Search | 16.44x | 9.07x to 32.81x | 4 |
| Standard Shopping | 5.62x | 4.17x to 11.57x | 9 |
| Performance Max | 4.95x | 1.87x to 8.42x | 13 |
| Non-brand Search | 3.09x | 1.81x to 4.44x | 6 |
| Demand Gen | 2.04x | 1.05x to 8.41x | 3 |
This study uses a different sample from the tables above: 22 Google Ads accounts (14 ecommerce, 8 lead generation) across several markets, with each account counted once per campaign type. ROAS is conversion value divided by cost inside each account, so currency does not affect it. Brand Search returns more because those searchers already know the store, which is why blended Search figures can make prospecting look stronger than it is.
Full paper and anonymised dataset: Google Ads Performance Benchmarks by Campaign Type (Sharma, 2026, Zenodo).
What else does our Zenodo benchmark paper show?
The paper adds two budget findings this page did not cover. Performance Max took a median 53.1% of spend in the ecommerce accounts, and non-brand Search took a median 49.2% of spend in the lead generation accounts, where it converted at a median 6.17%.
| Finding | Figure | Accounts |
|---|---|---|
| Sample size | 46.9 million impressions, 961 thousand clicks and 57.2 thousand conversions | 22 (14 ecommerce, 8 lead generation) |
| Performance Max share of account spend | 53.1% median | Ecommerce |
| Performance Max ROAS | 4.95x median | Ecommerce |
| Brand vs non-brand Search ROAS | 16.44x vs 3.09x median | Ecommerce |
| Non-brand Search share of account spend | 49.2% median | Lead generation |
| Non-brand Search conversion rate | 6.17% median | Lead generation |
| Metrics in the paper | Click-through rate, conversion rate and ROAS, as per-account medians with interquartile ranges | All 22 |
The 53.1% median sits close to the 55.7% Performance Max share in our wider spend table for 31 ecommerce businesses above. The two are measured differently. The paper takes the median of each account’s own share, while the spend table pools all spend, so larger accounts weigh more in it.
The paper itself notes that sample sizes per category are small and drawn from one agency’s portfolio, so read these figures as directional benchmarks, not market averages. To turn a ROAS median into a target for your own margin, use our break-even ROAS calculator. If Performance Max is taking most of your budget, our comparison of Performance Max vs Search shows how to split it, and our performance benchmark report sets these medians against our published case study results.
The paper is free to reuse under a CC BY 4.0 license. Cite it as: Sharma, I. (2026). Google Ads Performance Benchmarks by Campaign Type: Evidence from 22 Agency-Managed Accounts, October 2025 to September 2026 (Version 1.0). Zenodo. DOI 10.5281/zenodo.23719473. The Zenodo record holds the PDF paper and the anonymized CSV dataset.
Which other original findings have we published?
These figures come from accounts we manage, our own research or our published case studies. Each one links to the section with the full detail.
| Finding | Figure | Sample |
|---|---|---|
| Ecommerce ROAS, brand vs non-brand Search | 16.44x vs 3.09x median | 22-account study, Oct 2025 to Sep 2026 (DOI) |
| Lead generation non-brand Search | 6.17% median conversion rate, 49.2% median share of spend | 8 lead generation accounts, Oct 2025 to Sep 2026 (Zenodo) |
| Microsoft Ads search CPC | $4.74 weighted, $0.82 to $7.71 | 8 accounts, Sep 2025 to Sep 2026 |
| Microsoft vs Google search CPC, same clients | Cheaper in 2 accounts, dearer in 2 | 4 accounts, provisional |
| Search partner clicks inside Google Search campaigns | 3.0% of clicks, at a 3.33% CTR vs 11.17% on Google Search | US businesses we manage, Sep 2025 to Sep 2026 |
| Top PPC statistics pages repeating “$2 for every $1” | 15 of 21 | Pages read in full, 26 October 2026 |
| Median return multiple in our published case studies | 7.35x | 19 engagements that reported a multiple |
How we built it: we pulled the Google Ads data from our manager account on 26 October 2026. We merged multi-location brands into one business, kept businesses with at least 300 Google Search clicks, and left out agency and test accounts.
Client names stay private under our client agreements, and every industry row has at least five businesses. Three accounts with conversion rates above 30% were left out of the conversion rate median as tracking outliers. Full notes are in how we built this page, and every table is in our free dataset.
What are the PPC benchmarks for 2026?
The main PPC benchmarks for 2026 are a $5.42 median cost per click, a 6.64% click-through rate, an 8.18% conversion rate and a $66.69 cost per lead for Google search ads, from WordStream’s study of 13,474 US campaigns. Clicks got slightly more expensive, but conversion rates rose and cost per lead fell.
| Benchmark | 2026 figure | Year before | Source |
|---|---|---|---|
| Google Ads median cost per click | $5.42 | $5.26 | WordStream 2026 and 2025 |
| Google Ads median click-through rate | 6.64% | 6.66% | WordStream 2026 and 2025 |
| Google Ads median conversion rate | 8.18% | 7.52% | WordStream 2026 and 2025 |
| Google Ads median cost per lead | $66.69 | $70.11 | WordStream 2026 and 2025 |
| Paid CTR on queries with vs without an AI Overview | 16.2% vs 21.8% (February 2026) | 14.6% vs 26% (January 2025) | Seer Interactive, April 2026 |
| Paid search CPC change, same advertisers | Up 14% (Q2 2026) | Not applicable | Skai Q2 2026 |
| Google Search median CPC, 44 US businesses we manage | $3.18 | Median up 17% in the 30 businesses we managed both years | Hustle Marketers data, Sep 2025 to Sep 2026 |
| Microsoft Ads search CPC, weighted, 8 accounts we manage | $4.74 (range $0.82 to $7.71) | Not applicable | Hustle Marketers, Sep 2025 to Sep 2026 |
| US search ad revenue | $114.2 billion (2025) | $102.8 billion (2024, our calculation) | IAB/PwC, April 2026 |
The 2024 search revenue figure is our calculation from IAB’s statement that search grew by $11.4 billion to $114.2 billion. Industry breakdowns for each metric follow in the sections below.
How big is the PPC market in 2026?
The US paid search market was worth $114.2 billion in 2025, according to the IAB/PwC Internet Advertising Revenue Report. That is 38.8% of all US internet ad revenue. Search is still the largest single ad format, but its growth slowed to 11% in 2025 from 15.9% in 2024.
Paid search is growing, just more slowly than social media, commerce media and digital video. Social media and commerce media are now growing faster, and buyers expect that gap to continue in 2026.
| Statistic | Figure | Period | Source |
|---|---|---|---|
| US internet ad revenue | $294.6 billion, up 13.9% | 2025 | IAB/PwC, April 2026 |
| US search ad revenue | $114.2 billion, up 11.0% | 2025 | IAB/PwC, April 2026 |
| Search share of US internet ad revenue | 38.8% | 2025 | IAB/PwC, April 2026 |
| US search revenue growth in the prior year | 15.9% | 2024 | IAB, April 2026 |
| US social media ad revenue | $117.7 billion, up 32.6% | 2025 | IAB/PwC, April 2026 |
| US commerce media ad revenue | $63.4 billion, up 18.0% | 2025 | IAB/PwC, April 2026 |
| Share of US internet ad revenue taken by the top 10 companies | 84.1% | 2025 | IAB/PwC, April 2026 |
| Forecast growth in US paid search spend | 8.1% | 2026 | IAB buyer forecast, September 2026 |
| Forecast growth in US social ad spend | 16.5% | 2026 | IAB buyer forecast, September 2026 |
| Forecast growth in total US ad spend | 12.3% | 2026 | IAB buyer forecast, September 2026 |
| Buyers naming “optimizing content for AI-generated answers” as an area of increased focus (the No. 1 area) | 76% | 2026 | IAB, September 2026 |
| Global ad revenue forecast | $1.3 trillion, up 8.9% (excluding US political) | 2026 | WPP Media, June 2026 |
| Traditional and generative search as a share of global ad revenue | 21.8% | 2026 | WPP Media, June 2026 |
| Global generative search ad revenue forecast | $5.1 billion in 2026, over $100 billion by 2030 | 2026 to 2030 | WPP Media, June 2026 |
| Google’s share of US search ad spending | 48.5%, the first time below half in more than 20 years | 2026 forecast | EMARKETER |
| US AI search ad spending forecast | $2.08 billion in 2026, $25.93 billion in 2029 | 2026 to 2029 | EMARKETER |
One caution before you quote these side by side. IAB reports search as an ad format and social media as a channel that spans formats such as display and video, so the two figures overlap. That is why social ($117.7 billion) can sit above search ($114.2 billion) while search keeps the largest format share. Quote both numbers with that note, and never mix IAB’s search figure with older global estimates that use a wider definition.
How much do Google, Microsoft, Amazon and Meta earn from ads?
Google earned $224.5 billion from Search and other in 2025, according to Alphabet’s 10-K. That figure grew 17% to $63.3 billion in the second quarter of 2026. Amazon’s ad business reached $68.6 billion in 2025, Meta’s reached $196.2 billion, and Microsoft’s search advertising brought in $15.2 billion in its 2026 fiscal year.
| Platform | Ad revenue | Growth | Source |
|---|---|---|---|
| Google Search and other | $224.5 billion (2025) | 13.4% (our calculation from the filing) | Alphabet 10-K, FY2025 |
| Google Search and other | $63.3 billion (Q2 2026) | 17% | Alphabet Q2 2026 results |
| Google advertising, all formats | $294.7 billion (2025) | 11.4% (our calculation) | Alphabet 10-K, FY2025 |
| YouTube ads | $40.4 billion (2025) | 11.7% (our calculation) | Alphabet 10-K, FY2025 |
| Google Network | $29.8 billion (2025) | Down 1.9% (our calculation) | Alphabet 10-K, FY2025 |
| Microsoft search advertising | $15.2 billion (FY2026, to June 2026) | 9%, or 12% excluding traffic acquisition costs | Microsoft 10-K, FY2026 and annual report |
| Amazon advertising services | $68.6 billion (2025) | 22% (our calculation) | Amazon 10-K, FY2025 |
| Amazon advertising services | $19.8 billion (Q2 2026) | 26% | Amazon Q2 2026 results |
| Meta advertising | $196.2 billion (2025) | 22% | Meta FY2025 results |
| Meta advertising | $59.4 billion (Q2 2026) | 27% | Meta Q2 2026 results |
Google advertising was 73.2% of Alphabet’s $402.8 billion revenue in 2025, by our calculation from the filing. That corrects a figure still repeated on some stats pages, which claims 96% of Google’s revenue comes from ads.
What share of search does each engine have?
Google handles 89.94% of global search and 85.19% of US search across all devices, according to StatCounter’s September 2026 data. Bing is much stronger on desktop than on phones. StatCounter measures page views, not queries or ad clicks, so treat these as reach indicators.
| Market | Bing | Source | |
|---|---|---|---|
| Worldwide, all devices | 89.94% | 5.29% | StatCounter, September 2026 |
| US, all devices | 85.19% | 9.89% | StatCounter, September 2026 |
| US, desktop | 74.71% | 18.8% | StatCounter, September 2026 |
| US, mobile | 94.13% | 2.15% | StatCounter, September 2026 |
How many Google searches are there per day?
Google handles roughly 13.7 billion searches a day, by our calculation from Google’s own figure of “more than 5 trillion searches” a year, based on January 2025 data (Google, May 2025). That replaces the old “3.5 billion searches a day” estimate still found on many pages.
What is the average CPC for Google Ads in 2026?
The median Google Ads cost per click is $5.42, according to WordStream’s 2026 benchmarks, which cover 13,474 US search campaigns from April 2025 to March 2026. That is up 3.0% from $5.26 in the 2025 edition, by our calculation. Legal services pay the most, at $9.87 a click, and arts and entertainment the least, at $1.63.
WordStream reports medians, not averages, so one very expensive account does not pull the figure up. The intro to the study says the data covers Google Ads and Microsoft Ads campaigns, so read it as a search ads benchmark rather than a Google-only one.
Our own accounts sit lower overall but higher for local trades. Across 44 US businesses we manage, the median Google Search CPC was $3.18: $1.63 in ecommerce and $9.72 in home services and construction, above WordStream’s $8.33 for home and home improvement (our data).
What is the average cost per click by industry?
| Industry | Median CPC | Note | Source |
|---|---|---|---|
| Attorneys and legal services | $9.87 | Highest CPC of 23 industries | WordStream 2026 |
| Home and home improvement | $8.33 | Second highest | WordStream 2026 |
| Dentists and dental services | $8.00 | Third highest | WordStream 2026 |
| All industries | $5.42 | Median, up 3.0% year over year | WordStream 2026 |
| Animals and pets | $4.06 | Also has the highest conversion rate | WordStream 2026 |
| Arts and entertainment | $1.63 | Lowest CPC | WordStream 2026 |
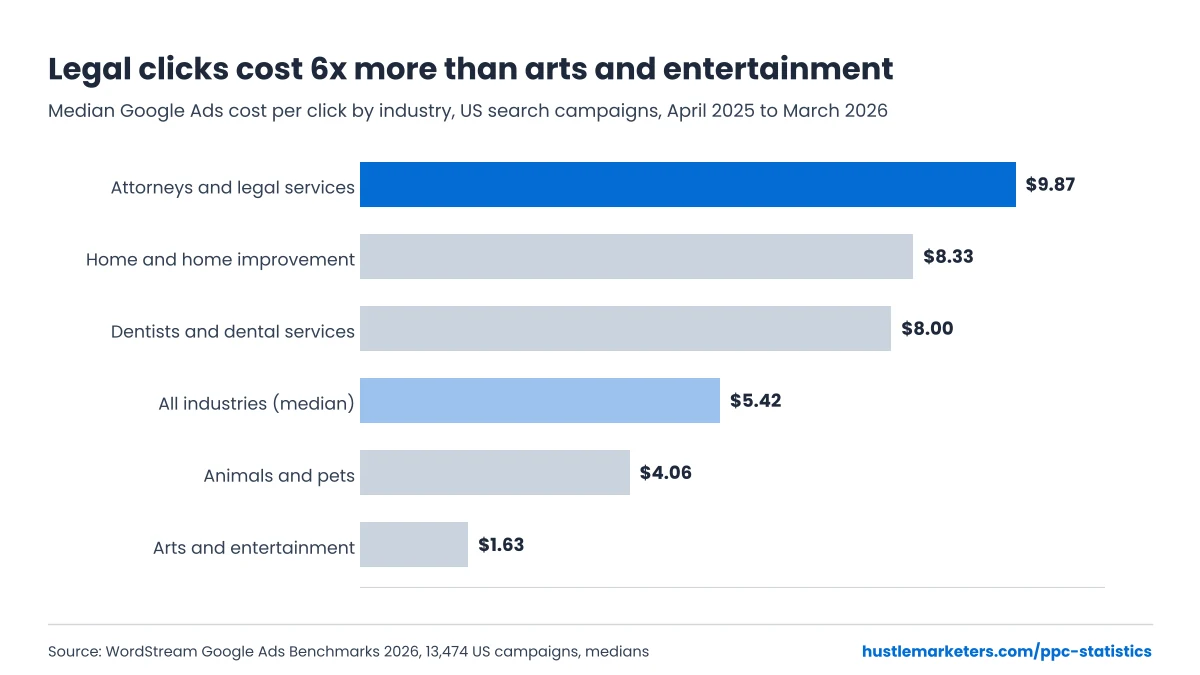
Two industry moves stand out in the same study. Real estate CPC rose 27.27% year over year, the biggest increase, while education and instruction CPC fell 22.79%, the biggest drop.
Local trades often pay far more than these medians. In LocaliQ’s home services data (3,211 campaigns, April 2024 to March 2025), painting CPC reached $13.74 and electricians $12.18 (LocaliQ, July 2026). Single keywords can cost much more again. Our list of the most expensive Google Ads keywords lists current examples, and our Google Ads cost guide turns these numbers into a budget.
Why are Google Ads CPCs rising?
Search ad CPCs are rising because more ad money is chasing a similar number of clicks. Skai saw paid search spend grow 17% year over year in Q2 2026 while clicks grew just 2%, which pushed CPC up 14% (Skai Q2 2026 report). Skai links the rise to AI answers settling more queries before a click: paid search impressions fell 6% in the same quarter.
How much your own CPC moves depends on your advertiser mix and keywords. Different benchmark sources show different speeds:
| Source and sample | Period | Spend | Clicks | CPC |
|---|---|---|---|---|
| Skai, paid search, same advertisers | Q2 2026 vs Q2 2025 | Up 17% | Up 2% | Up 14% |
| Tinuiti, Google search, same clients (reported by MediaPost; full report gated) | Q3 2026 vs Q3 2025 | Up just under 14% | Not published | Up 4% |
| Tinuiti, Microsoft search, same clients (reported by MediaPost) | Q3 2026 vs Q3 2025 | Up 12% | Down 3% | Up 16% |
| Hustle Marketers, Google Search, same 30 US businesses | Sep 2025 to Sep 2026 vs prior 12 months | Up 9.6% | Up 3.8% | Up 5.5% pooled; median business up 17% |
| WordStream, US search campaigns | Apr 2025 to Mar 2026 | Not reported | Not reported | Up 3.0% ($5.26 to $5.42, our calculation) |
Brand terms are the exception. Tinuiti found brand keyword CPCs fell 9% year over year in Q1 2026 (Tinuiti Q1 2026). Paid social is getting pricier too: Meta’s average price per ad rose 9% in 2025 (Meta FY2025 results) and 14% year over year in Q3 2026 (Meta Q3 2026 results).
Sudden jumps are a frequent complaint, and threads such as “My CPC went up 1000% after years of it being very consistent” in the Google Ads Community are common. In our experience, jumps like this usually trace back to a new competitor, a bid strategy change or broader matching. A market benchmark will not explain a jump that size, so check auction insights and the search terms report first.
What is a good CTR for Google Ads?
A good Google Ads click-through rate in 2026 is anything near or above the 6.64% median in WordStream’s benchmarks of 13,474 US search campaigns. Industry matters a lot: arts and entertainment reached 12.75%, while automotive repair, service and parts sat lowest at 5.56%.
In the 44 US businesses we manage, the median Google Search CTR was 7.73%, from 4.03% in home services to 12.72% in ecommerce, where brand searches make up much of the traffic (our data).
CTR also depends on the results page. Seer Interactive tracked 296.9 million paid impressions from January 2025 to February 2026. Paid CTR on queries with an AI Overview rose from 14.6% to 16.2%, while paid CTR on queries without one fell from 26% to 21.8% (Seer Interactive, April 2026).
A high CTR is not proof that a campaign works. Google Ads Community threads like “Getting clicks and good ctr but recieving zero phone cals and leads” show the pattern. Broad keywords can attract cheap, curious clicks. Judge CTR alongside conversion rate and cost per lead.
Which Google Ads limits affect CTR?
Responsive search ads accept up to 15 headlines and 4 descriptions, and Google can show up to 3 headlines at once. Headlines allow 30 characters and descriptions 90 (Google Ads Help 7684791). Quality Score runs from 1 to 10 at keyword level, and Google states it “is not an input in the ad auction” (Google Ads Help 6167118). Its three parts are expected CTR, ad relevance and landing page experience.
What is the average Google Ads conversion rate?
The median Google Ads conversion rate is 8.18% in WordStream’s 2026 benchmarks, up from 7.52% a year earlier. Conversion rate rose in 87% of the 23 industries studied. Animals and pets converted best at 16.22%, while finance and insurance converted worst at 2.64%. WordStream counts any tracked action as a conversion, so retail-type categories sit lower: shopping, collectibles and gifts converts at 4.01% and apparel at 4.50%.
In the US businesses we manage, the median Google Search conversion rate was 7.42% across 41 businesses with comparable tracking, and 5.39% for ecommerce stores, where most conversions are purchases (our data).
| Industry | Median conversion rate | Source |
|---|---|---|
| Animals and pets | 16.22% (highest) | WordStream 2026 |
| Automotive repair, service and parts | 15.51% | WordStream 2026 |
| All industries | 8.18% | WordStream 2026 |
| Attorneys and legal services | 5.55% | WordStream 2026 |
| Career and employment | 3.05% | WordStream 2026 |
| Furniture | 2.99% | WordStream 2026 |
| Finance and insurance | 2.64% (lowest) | WordStream 2026 |
How much does page speed change conversion rate?
A 0.1 second faster mobile site raised conversion rates by 8.4% for retail sites and 10.1% for travel sites in a Deloitte study for Google of 37 brands (web.dev, data from 2019). The often-quoted “53% of mobile site visits are abandoned if pages take longer than 3 seconds to load” comes from 2016 DoubleClick research and is still on Google AdSense Help without a year, so quote it with the year.
What is the average cost per lead in Google Ads?
The median Google Ads cost per lead is $66.69 in WordStream’s 2026 benchmarks, down 4.9% from $70.11 a year earlier (our calculation). WordStream says it is the first decline in five years. Legal services had the highest cost per lead at $131.63, and arts and entertainment the lowest at $26.84.
| Industry | Median cost per lead | Source |
|---|---|---|
| Attorneys and legal services | $131.63 | WordStream 2026 |
| Furniture | $106.70 | WordStream 2026 |
| Real estate | $102.51 | WordStream 2026 |
| Home and home improvement | $90.92 | WordStream 2026 |
| Dentists and dental services | $72.97 | WordStream 2026 |
| All industries | $66.69 | WordStream 2026 |
| Animals and pets | $31.50 | WordStream 2026 |
| Automotive repair, service and parts | $29.96 | WordStream 2026 |
| Arts and entertainment | $26.84 | WordStream 2026 |
One detail for careful readers: WordStream’s 2026 figures for legal ($131.63) and home improvement ($90.92) are identical to the cent to its 2025 edition. Home services trades vary even more. LocaliQ’s 2025 home services data puts roofing and gutters at $228.15 per lead, doors and windows at $200.34 and plumbing at $129.02 (LocaliQ, July 2026).
Benchmarks show where an account starts, not where it has to stay. In our commercial cleaning equipment case study, Google Ads produced 5.3x more leads at a 73% lower cost per lead. For a local driver training school, we documented a 35% lead increase and a 300% ROI.
How do AI Overviews and AI Mode affect PPC?
AI Overviews change where clicks go, and they affect ads and organic results differently. Pew Research found people clicked a traditional result in 8% of visits with an AI summary, against 15% without one. Seer’s 2026 data shows paid CTR on AI Overview queries rising to 16.2% by February 2026, still below the 21.8% seen on queries without one.
| Statistic | Figure | Scope | Source |
|---|---|---|---|
| Visits with a click on a traditional result, with vs without an AI summary | 8% vs 15% | 900 US adults, 68,879 searches, March 2025 | Pew Research, July 2025 |
| Visits where people clicked a link inside the AI summary | 1% | Same study | Pew Research, July 2025 |
| Searches that showed an AI summary | 18% | Same study | Pew Research, July 2025 |
| Paid CTR with vs without an AI Overview | 16.2% vs 21.8% | February 2026; 53 brands, 296.9M paid impressions tracked January 2025 to February 2026 | Seer Interactive, April 2026 |
| Paid CTR on informational queries with an AI Overview | Down from 19.70% to 6.34% | 3,119 informational queries, June 2024 to September 2025 | Seer Interactive, November 2025 |
| Paid CTR when the brand is cited in the AI Overview vs not cited | 7.89% vs 4.14% | Q3 2025, correlation only | Seer Interactive, November 2025 |
| Organic position 1 CTR when an AI Overview shows | 58% lower | 300,000 keywords, desktop, December 2025 | Ahrefs, February 2026 |
| US Google searches that ended without a click | 68.01% | US desktop and mobile browsers (excludes the Google app), January to April 2026 | SparkToro, June 2026 |
| AI Overviews monthly active users | Over 2.5 billion | Global | Google I/O, May 2026 |
| AI Mode monthly active users | Over 1 billion | Global | Alphabet Q2 2026 remarks |
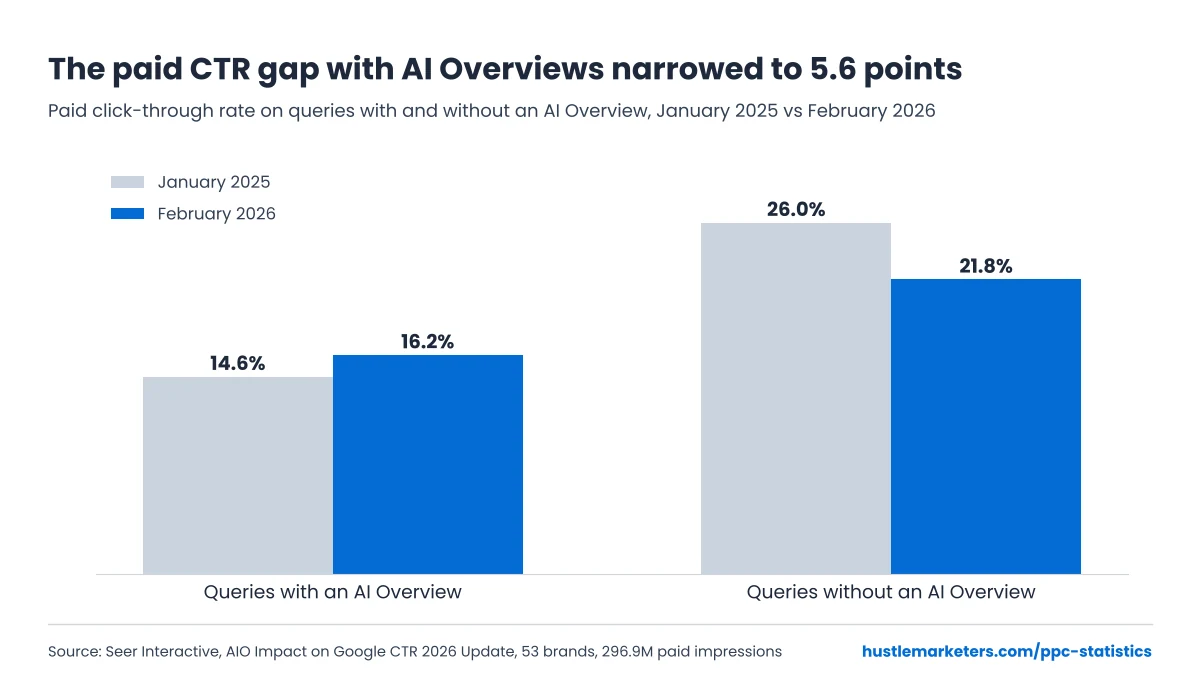
The Seer figures need context. The steep 68% paid CTR drop covers informational queries only. Seer’s broader 2026 update, across 53 brands, found paid CTR on AI Overview queries rising from 14.6% to 16.2%, and concluded that AI Overviews are “not doing the same thing to paid ads” as to organic results.
How many Google searches end without a click?
About two in three US Google searches now end without a click. SparkToro measured 68.01% zero-click searches in US desktop and mobile browsers from January to April 2026, using Similarweb data and excluding the Google app (SparkToro, June 2026). Its 2024 study, on a different data panel, put the figure at 58.5% (SparkToro, July 2024).
Two cautions for anyone quoting these. The two studies use different panels, so the change between them is not a clean trend line. And SparkToro says it could not directly calculate the share of clicks that went to paid ads in 2026, so these figures should not be used as a paid click share. Zero-click search is one of the shifts covered in our digital marketing trends for 2027.
Do ads show inside AI Overviews and AI Mode?
Yes. Google launched ads in AI Overviews on US mobile on 3 October 2024 (Google) and announced the US desktop expansion on 21 May 2025 (Google). Google also began testing ads in AI Mode in May 2025, where they can appear below and within AI Mode responses.
Ads inside AI Overviews now run in English in 12 markets, including the US, Canada, Australia and India. Ads above or below AI Overviews run in more than 200 markets (Google Ads Help 16297775).
There is one gap advertisers keep asking about. Google Ads does not offer segmented reporting for ads shown inside AI Overviews, so you cannot see those clicks as a separate line. For the organic side of the same change, see our guide to optimizing for Google AI Overviews.
What do AI Max, Performance Max and Smart Bidding deliver?
Google says advertisers who switch on AI Max for Search typically see 14% more conversions or conversion value at a similar cost per acquisition or ROAS. Beyond retail, Performance Max adds 27% more conversions or value on average at a similar CPA or ROAS, by Google’s figures from late 2023. Both numbers are Google’s own, measured on Google’s terms, so test them against a control in your own account.
| Feature | Google’s claim | Conditions | Source |
|---|---|---|---|
| AI Max for Search | 14% more conversions or value | Typical result at similar CPA or ROAS, Google internal data 2025 | Google, May 2025 |
| AI Max for Search | 27% more conversions or value | Only campaigns with over 70% of conversions from exact or phrase match, non-retail | Google, May 2025 |
| AI Max, full feature suite | 7% more conversions or value | Compared with search term matching alone, 2026 data | Google, April 2026 |
| Performance Max | 27% more conversions or value | Similar CPA or ROAS, “beyond retail”, October to November 2023 data | |
| Smart Bidding Exploration | 27% more unique converting users | Search text ads, January to February 2026 | Google, May 2026 |
Adoption is already high in retail. Performance Max took 67% of Google Shopping ad spend in Q1 2026, up from 53% a year earlier, among Tinuiti advertisers running both Performance Max and standard Shopping campaigns (Tinuiti). Dynamic Search Ads will also be upgraded to AI Max automatically from February 2027, per Google’s June 2026 update.
Our accounts show the same shift. Performance Max took 48.2% of Google Ads spend across 75 businesses we manage, and 55.7% in ecommerce, from September 2025 to September 2026 (our data).
Our view from managing these campaigns: the lift is real in some accounts and absent in others. When Performance Max stalls, the cause is usually feed quality, conversion signals or budget, which we cover in why Performance Max is not performing.
Is Microsoft Ads cheaper than Google Ads?
Microsoft Ads is not reliably cheaper than Google Ads. The popular “Bing is 33% cheaper” figure comes from 2017 WordStream data. In our own like-for-like comparison of four client accounts, Microsoft search clicks were cheaper in two accounts and dearer in two. The answer depends on your vertical and which Microsoft network your clicks come from.
From our accounts: We compared Microsoft Advertising data across 16 accounts we manage, from 11 September 2025 to 10 September 2026. The sample leans toward US ecommerce and B2B. Full method and account tables are in our Bing Ads vs Google Ads CPC study.
| Finding | Figure | Sample |
|---|---|---|
| Microsoft search CPC range | $0.82 to $7.71 | 8 accounts with search data, Sep 2025 to Sep 2026 |
| Weighted Microsoft search CPC and CTR | $4.74 CPC, 4.02% CTR | 20,876 search clicks, same 8 accounts |
| Clicks bought on Microsoft Sites and Select Traffic | 85,810 of 281,296 clicks, fewer than a third | 8 accounts, a separate set from the 8 search accounts |
| Blended CPC that understated true search CPC | 5 of 8 accounts, by up to 184% | Blended vs search-only CPC |
| Syndicated partner CTR vs core Microsoft search CTR | 15% to 16% vs 2% to 6% | 3 accounts |
| Microsoft vs Google search CPC, same clients | Cheaper in 2 accounts (68% and 72% cheaper), dearer in 2 (52% and 72% dearer) | 4 accounts, provisional, full account history |
What did Microsoft search clicks cost in each account?
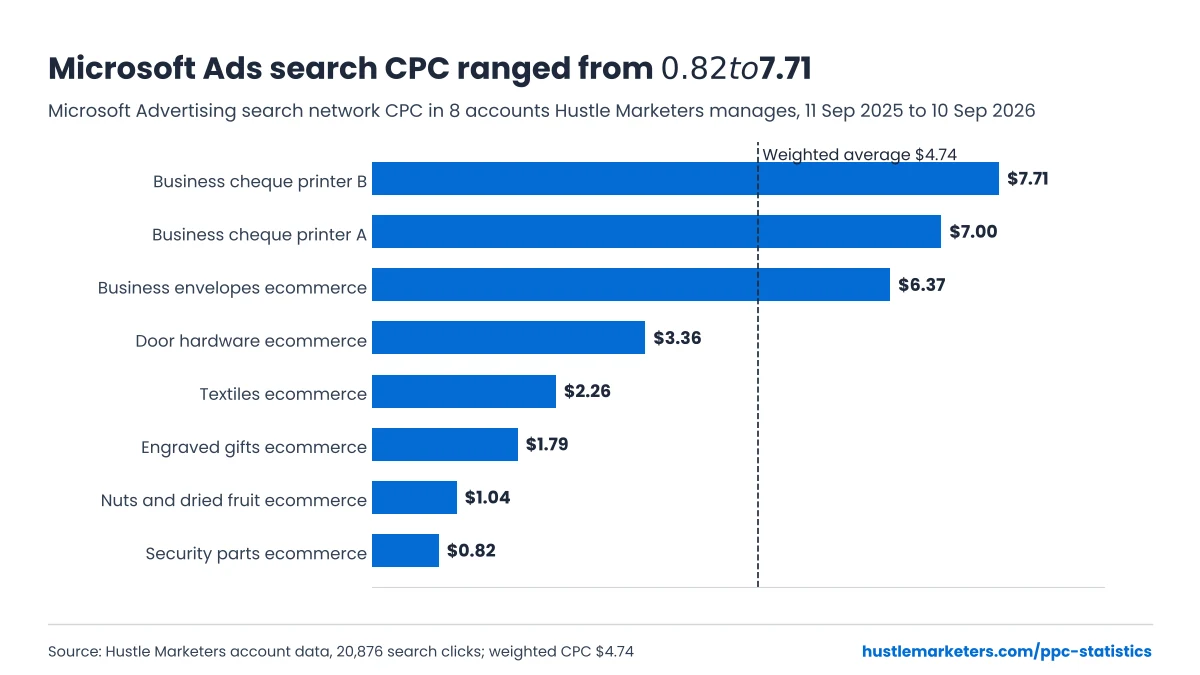
Search-only CPC ranged from $0.82 to $7.71 across the eight accounts with Microsoft search data. Business printing accounts paid the most, and low-price ecommerce stores the least.
| Account (anonymized) | Search clicks | Search CTR | Microsoft search CPC |
|---|---|---|---|
| Business cheque printer B | 3,580 | 5.71% | $7.71 |
| Business cheque printer A | 4,177 | 4.35% | $7.00 |
| Business envelopes ecommerce | 3,259 | 3.27% | $6.37 |
| Door hardware ecommerce | 2,829 | 3.96% | $3.36 |
| Textiles ecommerce | 2,946 | 4.01% | $2.26 |
| Engraved gifts ecommerce | 1,751 | 4.62% | $1.79 |
| Nuts and dried fruit ecommerce | 606 | 1.82% | $1.04 |
| Security parts ecommerce | 1,728 | 3.82% | $0.82 |
| All eight accounts | 20,876 | 4.02% | $4.74 weighted |
How much does a blended Microsoft CPC hide?
A blended CPC understated the true search CPC in five of eight accounts, by up to 184%. Cheap partner and audience clicks pull the blended number down, so the search clicks you care about cost more than the dashboard total suggests.
| Account (anonymized) | Blended CPC | True search CPC | Blended understates by | Search share of clicks |
|---|---|---|---|---|
| UK consumer brand | $0.19 | $0.54 | 184% | 11.6% |
| Driver training provider | $0.83 | $2.26 | 172% | 23.2% |
| Industrial coatings ecommerce | $0.45 | $0.83 | 84% | 27.5% |
| Furniture ecommerce | $1.30 | $2.12 | 63% | 34.9% |
| Beauty supplies ecommerce | $0.24 | $0.32 | 33% | 34.2% |
| Driving school | $0.85 | $0.81 | No, 5% the other way | 50.5% |
| Pet products ecommerce | $1.51 | $1.47 | No, 3% the other way | 6.5% |
| Animation studio | $1.22 | $1.06 | No, 13% the other way | 15.0% |
Is Microsoft cheaper than Google for the same business?
Not reliably. In four accounts that run both platforms, Microsoft search clicks were cheaper in two and dearer in two. This comparison is provisional because it uses full account history, not the matched 12-month window.
| Account (anonymized) | Microsoft search CPC | Google search CPC | Result |
|---|---|---|---|
| Industrial coatings ecommerce | $0.83 | $2.92 | Microsoft 72% cheaper |
| Driver training school | $0.81 | $2.55 | Microsoft 68% cheaper |
| Furniture ecommerce | $2.12 | $1.23 | Microsoft 72% dearer |
| Pet products ecommerce | $1.47 | $0.97 | Microsoft 52% dearer |
Microsoft’s own numbers show a growing business. Search advertising revenue excluding traffic acquisition costs grew 12% in fiscal 2026 (Microsoft annual report), and Bing reached 1 billion monthly active users for the first time (Microsoft, April 2026). Microsoft also reports that Copilot users engaged more with ads, with 73% higher CTR and 16% stronger conversion rates than traditional search, based on its own February to May 2025 data (Microsoft Advertising, August 2025).
The practical point: check the network split before you compare CPCs. A cheap blended Microsoft CPC can hide expensive search clicks underneath it, as our table shows. When the split is right, Microsoft can carry an account: our commercial flooring case study reached 10.8x ROAS on Microsoft Advertising, with one campaign at 16.1x.
What are the Meta Ads benchmarks for 2026?
The median Meta lead campaign paid $1.80 a click, converted 8.54% of clicks and produced leads at $27.39 each, in WordStream’s 2026 Facebook ads benchmarks for US campaigns. Traffic campaigns paid $0.60 a click at a 1.93% click-through rate. Clicks got cheaper than a year earlier, even as Meta’s own price per ad rose.
| Campaign type | Metric | 2026 median | 2025 median |
|---|---|---|---|
| Traffic | Click-through rate | 1.93% | 1.71% |
| Traffic | Cost per click | $0.60 | $0.70 |
| Leads | Click-through rate | 2.70% | 2.59% |
| Leads | Cost per click | $1.80 | $1.92 |
| Leads | Conversion rate | 8.54% | 7.72% |
| Leads | Cost per lead | $27.39 | $27.66 |
Source: WordStream Facebook Ads Benchmarks 2026, updated 15 September 2026. US medians, 1 April 2025 to 30 June 2026, from 1,377 traffic campaigns and 452 lead campaigns. Use the published cost per lead as it is. Medians do not combine, so you cannot get the cost per lead by dividing the CPC by the conversion rate.
Industry spread is wide. Dentists had the highest median cost per lead at $61.56, while career and employment ($12.30) and real estate ($13.74) had the lowest. Some industry figures rest on samples as small as four campaigns, so treat them as directional. Our guide on how to advertise on Facebook shows how to budget for lead ads by industry.
At platform level, Meta’s average price per ad rose 14% year over year in Q3 2026, and ad impressions grew 10% (Meta Q3 2026 results, global). For Meta results from accounts we manage, see the Judaica ecommerce case study, which reached 15.47x ROAS on Meta.
How much should a small business spend on Google Ads?
A small business should budget from its target number of leads, not from a round monthly figure. At WordStream’s 2026 median cost per lead of $66.69, 20 leads a month costs about $1,334 in ad spend. A law firm at the legal median of $131.63 would need about $2,633 for the same 20 leads.
We built this table from the WordStream 2026 medians. It shows ad spend only, before management fees, and real accounts land above or below the median.
| Industry | Median cost per lead | 10 leads a month | 20 leads a month | 50 leads a month |
|---|---|---|---|---|
| Attorneys and legal services | $131.63 | $1,316 | $2,633 | $6,582 |
| Home and home improvement | $90.92 | $909 | $1,818 | $4,546 |
| Dentists and dental services | $72.97 | $730 | $1,459 | $3,649 |
| All industries | $66.69 | $667 | $1,334 | $3,335 |
| Arts and entertainment | $26.84 | $268 | $537 | $1,342 |
Source for the cost per lead figures: WordStream 2026 benchmarks. Monthly figures are our calculation (leads multiplied by median cost per lead), rounded to the nearest dollar.
Small tests are often judged too early. A post in the Google Ads Community titled “I’m a new advertiser and I’ve spent $75 with no conversions” is a typical case. At the $5.42 median CPC, $75 buys about 14 clicks. At an 8.18% conversion rate, that is roughly one expected conversion, which is too little data to judge a campaign either way.
For fee ranges, see our PPC management pricing page, and for small budgets, our guide to PPC management for small business.
How much PPC spend is lost to invalid clicks?
No one publishes a neutral industry-wide invalid click rate. Google states that “there is no industry standard for a normal invalid traffic rate” and says advertisers are not charged for invalid traffic it detects before billing. A fraud-prevention vendor, Lunio, measured 5.21% invalid traffic on Google Search campaigns and 8.51% across all channels it monitored.
| Channel | Invalid traffic rate | Source |
|---|---|---|
| Google Search campaigns | 5.21% | Lunio (vendor data), 2.7B clicks, Aug 2024 to Jul 2025 |
| Google Ads, all campaign types | 7.57% | Lunio (vendor data) |
| Meta | 8.20% | Lunio (vendor data) |
| Microsoft (Bing) | 10.32% | Lunio (vendor data) |
| All channels monitored | 8.51% | Lunio (vendor data) |
Read these as upper estimates. Lunio sells click fraud protection, and its figures measure traffic that got past platform filters in monitor-only mode. Google’s own policy is on its invalid traffic help page. If you run Microsoft Ads, our guide to Bing Ads click fraud shows how to spot bot clicks and claim credits.
Google also removes bad ads at scale. In 2025 it blocked or removed over 8.3 billion ads, suspended 24.9 million advertiser accounts, and took down 602 million scam-related ads. Its systems caught over 99% of policy-violating ads before they served (Google Ads Safety Report, April 2026).
What is the average ROI of PPC?
There is no reliable industry-wide average ROI for PPC. The widely quoted “200% ROI”, or $2 back for every $1, is a modeling assumption in Google’s Economic Impact methodology: $2 in profit, based on a 2009 paper by Hal Varian. Real PPC ROI depends on your margin, your fees and how you count conversions.
ROAS and ROI are often mixed up. ROAS divides revenue by ad spend. ROI also takes off the cost of the product and your fees. Here is a simple example with round numbers:
| Item | Example figure |
|---|---|
| Ad spend | $1,000 |
| Revenue from ads (4x ROAS) | $4,000 |
| Gross profit at a 40% margin | $1,600 |
| Profit after ad spend | $600 |
| ROI on ad spend | 60% |
A 4x ROAS can look strong and still return only 60% on spend once margin is counted, and less after management fees. Our guides to ROAS vs break-even ROAS vs target ROAS and what counts as a good marketing ROI walk through the math for your own numbers. For real ROAS results by vertical, see our Google Ads case studies further down.
Is PPC still worth it in 2026?
Yes, PPC is still worth it for most businesses that track conversions properly and know their margins. Advertisers keep spending: Google Search and other revenue grew 17% in Q2 2026. Results also improved in 2026 benchmarks, with conversion rates up in 87% of industries and the median cost per lead down 4.9%. The trade-off is rising click prices.
The doubts are real. Merchants post threads like “Google Ads are a waste of money” on the Shopify Community after spending hundreds of dollars with no sales. In the accounts we audit, the cause is usually tracking, match types or a budget too small to collect data, rather than the channel itself.
Is Google Ads worth it for small businesses?
Google Ads is worth it for a small business when the budget can buy enough clicks to learn from. At the 2026 median of $5.42 a click and an 8.18% conversion rate, about 12 clicks produce one conversion on average. A budget that buys only a few dozen clicks a month will not tell you much either way. The budget table above shows what common lead targets cost.
What do Hustle Marketers’ own engagements show?
From our accounts: Our Performance Benchmark Report covers 44 client engagements published as case studies between 2023 and July 2026. Nineteen reported a return multiple. The median was 7.35x and the range 5.12x to 30x. These are documented successes, so treat them as a ceiling, not a market average or a forecast for your account.
Which Google Ads case studies back these numbers?
These are published Hustle Marketers case studies from Google Ads and Microsoft Ads accounts, with the headline result each one documents. They are documented successes, so read them as what is possible with the right setup, not as averages. The full list is on our case studies page.
| Business | Platform | Published result | Case study |
|---|---|---|---|
| CANA Wine Company, US wine and spirits store | Google Ads | 17.35x ROAS and $177K revenue in 120 days | CANA Wine case study |
| Eichlers, Judaica ecommerce | Google Ads and Meta | 17.15x ROAS on Google Ads and 15.47x on Meta | Eichlers case study |
| UK curly hair brand on Shopify | Google Ads | 15.25x ROAS | Curly hair brand case study |
| Commercial flooring brand | Microsoft Advertising | 10.8x ROAS, one campaign at 16.1x | Commercial flooring case study |
| Building-block toy brand | Google Ads | $0 to 8.5x ROAS in 60 days | Toy brand case study |
| MiKi Jewellery, Australia | Google Ads | 7.81 ROAS in under 7 weeks | MiKi Jewellery case study |
| Local signage company | Google Ads | 1.5x to 7.35x ROAS | Signage company case study |
| Pet accessories brand | Google Ads and Meta | $346K revenue at 5.12x ROAS | Pet accessories case study |
| Training equipment brand | Google Ads | 6x revenue in 3 months | Training equipment case study |
| Commercial cleaning equipment supplier | Google Ads | 5.3x more leads at a 73% lower cost per lead | Cleaning equipment case study |
| Brisbane commercial cleaning equipment dealer | Google Ads | Revenue doubled in month 2 | Brisbane dealer case study |
| Driver training school, Massachusetts | Google Ads | 35% more leads and a 300% ROI | Driver training case study |
| White label PPC client, Richardson, Texas | Google Ads | 30x ROAS | White label case study |
How long does PPC take to show results?
In our documented engagements, a new Google Ads build reached its first documented result in 45 days at the fastest, and typically in 2 to 3 months. SEO took longer, as the table shows.
| Channel | Fastest documented result | Typical documented range |
|---|---|---|
| Google Ads, new build from zero | 45 days | 2 to 3 months |
| Google Ads, zero to strong ROAS | 60 days | 2 to 3 months |
| Google Ads, revenue doubling | Month 2 | 2 to 4 months |
| Google Ads, scaling to peak multiple | 3 to 6 months | 6 months to sustained |
| Ecommerce SEO | 3 months | 3 to 6 months |
| Local and AI search visibility | 6 months | 6 to 12 months |
Source: Hustle Marketers Performance Benchmark Report 2026, 44 published engagements. If you are weighing paid against organic, our SEO vs PPC comparison uses click data from 2025 and 2026.
Want a second opinion on your own numbers? We look for wasted spend, tracking gaps and missed conversions in your Google Ads and Microsoft Ads accounts. Get Free Audit Worth $500
Which popular PPC statistics are outdated or wrong?
Many of the most quoted PPC statistics are 5 to 17 years old or cannot be traced to a primary source. We read 21 top-ranking PPC and Google Ads statistics pages in full in October 2026. Most repeat the “$2 for every $1” figure without its year, and most still quote WordStream benchmarks from before 2020.
| Popular claim | Where it really comes from | Data year | What to quote instead |
|---|---|---|---|
| “Businesses make $2 for every $1 spent on Google Ads” | An assumption in Google’s Economic Impact methodology: $2 in profit, not revenue, based on a 2009 paper by Hal Varian | 2009 | Describe it as Google’s modeling assumption, not a measured average return |
| “Average CPC is $2.69 and CTR is 3.17%” | A WordStream post with data from August 2017 to January 2018 | 2017 to 2018 | $5.42 CPC and 6.64% CTR (WordStream 2026) |
| “PPC visitors are 50% more likely to buy than organic visitors” | No primary source found. The closest research is a 2009 Engine Ready retail study reported by the New York Times, which has no 50% figure | 2009 or unknown | Drop it |
| “Bing Ads are 33% cheaper, $1.54 CPC” | WordStream data from 2017 | 2017 | Our like-for-like data (4 accounts, full account history, provisional): cheaper in 2, dearer in 2 |
| “65% of clicks on buying keywords go to ads” and “about half of searchers cannot tell ads from organic results” | A WordStream infographic from July 2012, when results pages looked very different | 2012 | Seer’s paid CTR data from 2025 and 2026 |
| “Search ads lift brand awareness by 80%” | Google and Ipsos MediaCT, 61 simulated search experiments run January to December 2013 (published June 2014), top ad position only. The 80% is a relative lift in top-of-mind awareness; the absolute gain was 6.6 percentage points | 2013 | The 6.6 point (80% relative) lift, with its year and the top-position condition |
| “89% of search ad clicks are incremental” | Google research based on 400+ ad pause studies | 2011 | Quote it with the year, or run your own incrementality test |
| “Google handles 3.5 billion searches a day” | A third-party estimate, not a Google figure | Unknown | Google: more than 5 trillion searches a year (2025) |
| “Performance Max delivers 13% more conversions” | Google’s 2021 launch claim | 2021 | Google’s current claim: 27% (2023 data, self-reported) |
How often do top PPC statistics pages repeat outdated stats?
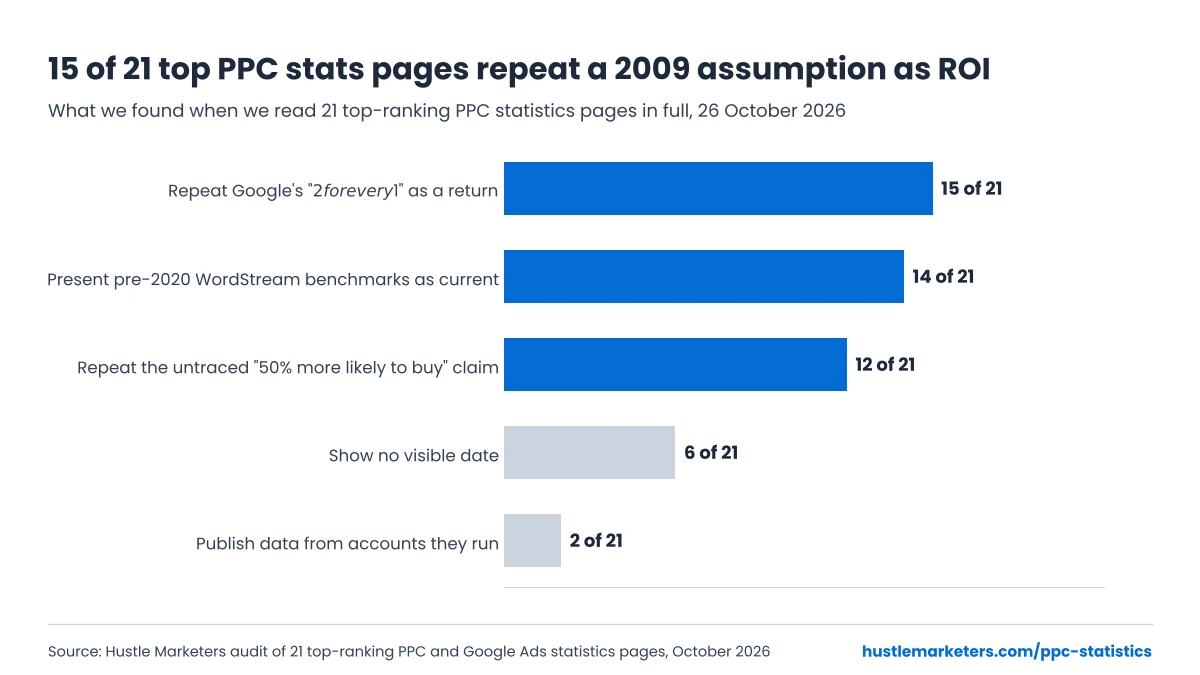
Most of them do. We read 21 top-ranking PPC and Google Ads statistics pages in full on 26 October 2026. Fifteen repeated Google’s “$2 for every $1” figure, and none of the 13 we could check gave the year behind it. Only 2 published data from accounts they run.
| What the page does | Pages | Share |
|---|---|---|
| Repeats “$2 for every $1” (or “$8 for every $1”) as a return | 15 of 21 | 71% |
| Presents pre-2020 WordStream benchmarks as current | 14 of 21 | 67% |
| Repeats the untraced “50% more likely to buy” claim | 12 of 21 | 57% |
| Shows no visible date | 6 of 21 | 29% |
| Repeats the 2017 “Bing is 33% cheaper” claim | 4 of 21 | 19% |
| Explains any methodology | 3 of 21 | 14% |
| Publishes data from accounts it runs | 2 of 21 | 10% |
| Quotes WordStream’s 2026 figures (third-party pages only) | 1 of 17 | 6% |
| Offers an embed or citation option | 1 of 20 | 5% |
We do not name the pages, because the point is the pattern. Popular statistics get copied from page to page, and each copy drops a little more context, such as the year or the sample. Our method is in how we built this page.
Do AI answers repeat outdated PPC statistics?
Yes, these errors now travel through AI answers too. When we asked Google AI Mode for “ppc statistics 2026” on 26 October 2026 (US, English), its answer still listed a 200% ROI from “$2 for every $1”, Microsoft Ads at “33% lower” CPC, and Google at “over 90%” of search. All three come from the outdated sources in the table above.
One habit avoids most of these errors: before you quote a statistic, open the original source and note the year the data was collected, not the date the page was last updated.
Why do PPC benchmarks disagree?
PPC benchmarks disagree because they measure different things. The Google Ads conversion rate on popular stats pages ranges from 1.91% to 8.18%. The gap comes from the year of the data, medians versus averages, the mix of lead generation and ecommerce accounts, and whether Microsoft Ads data is blended in.
- Data year: WordStream’s 2016 to 2019 posts and its 2026 study sit years apart, and older figures keep circulating.
- Median or mean: WordStream reports medians. A mean is pulled up by a few large accounts.
- Sample: same-client panels can disagree even within one quarter. In Q2 2026, Skai saw paid search CPC up 14%, while Tinuiti saw Google search CPC up about 1% (as reported by MediaPost).
- Conversion definition: a phone call, a form fill and a purchase all count as conversions in most benchmarks.
- Reporting level: blended CPC mixes cheap partner or display clicks with search clicks. In one account we manage, Google reported a blended CPC of $0.65 while search-only CPC was $2.55.
Compare your account with a benchmark that matches your industry, campaign type and data year. If you want a structured way to do that, our Google Ads audit checklist covers the checks we run.
How we built this page
We checked every statistic on this page at its original source on 26 October 2026. Primary sources come first: company filings with the SEC, platform documentation, and first-party studies such as IAB/PwC, WordStream, Pew Research and Seer Interactive. Vendor data is marked as vendor data.
- Platform figures marked “our calculation” are worked out from numbers in the filing.
- Google’s and Microsoft’s performance claims are self-reported, and we say so next to each one.
- Our own figures come from accounts Hustle Marketers manages and from case studies published on this site. Client names are not shown.
- Our Google Ads benchmarks use Search campaigns on the Google Search network from 11 September 2025 to 10 September 2026. Search partners and display expansion are excluded. Each business counts once, multi-location brands are merged, and only US businesses with 300 or more Google Search clicks are in the industry table. Non-US accounts were converted to US dollars with Google’s own currency conversion.
- Conversion rates use each account’s primary conversion actions, such as purchases, leads, calls and bookings. Three accounts above 30% were treated as tracking outliers and left out of that median.
- Client work is covered by confidentiality agreements, so we publish medians only, never a single client’s figures, and every industry row has at least five businesses.
- Our audit of statistics pages read 21 of the 22 top-ranking PPC and Google Ads statistics pages in full on 26 October 2026. One page could not be read. We counted claims as written on each page.
- Our Google Ads benchmarks are published as a free Google Ads Benchmarks 2026 sheet, with charts.
- Every table on this page is published as a free Google Sheets dataset, with the source link for each row.
- We update this page after each quarterly earnings season and rebuild it every January.
Changelog: 26 October 2026, first published with our Google Ads data from 44 US businesses, Meta Ads benchmarks and Meta’s Q3 2026 results. Other market figures use the Q2 2026 earnings releases, and Q3 2026 figures will be added once Alphabet, Microsoft and Amazon have reported. 28 October 2026: added the full findings of our 22-account campaign type benchmark paper, published on Zenodo.
PPC statistics FAQs
What is a good CPC for Google Ads in 2026?
A good CPC is one your conversion rate and margins can carry. As a reference, the 2026 median is $5.42 across 23 industries in WordStream’s benchmarks, and $3.18 across 44 US businesses we manage. Legal services pay $9.87 and arts and entertainment $1.63. If your CPC sits well above your industry median, check match types, Quality Score and competitors in auction insights.
How much should I spend on Google Ads per day?
Work back from the leads you need. At the 2026 median cost per lead of $66.69, 20 leads a month is about $1,334, or roughly $44 a day. Give a new campaign enough budget to collect at least a few dozen clicks a week, or the data will be too thin to judge.
Why am I getting clicks but no calls or leads?
Clicks without leads usually point to broad or irrelevant search terms, missing conversion tracking, or a landing page that does not match the ad. Check the search terms report first, then confirm calls and forms are tracked as conversions. A high CTR on its own does not show the clicks are from buyers.
Which platform is most commonly used for PPC?
Google Ads is the most used PPC platform. Google holds 89.94% of global search (StatCounter, September 2026) and earned $224.5 billion from search in 2025, against $15.2 billion for Microsoft search advertising in its 2026 fiscal year. For product searches, Amazon is the main alternative, with $68.6 billion in ad revenue in 2025.
Can I see how many ad clicks come from AI Overviews?
No. Google Ads Help says the platform does not currently offer segmented reporting for ads shown within AI Overviews. Ads inside AI Overviews run in English in 12 markets, including the US. You can watch overall CTR and search terms for changes, but not an AI Overview line on its own.
Is PPC better than SEO?
Neither is better in every case. PPC buys visibility now and is easier to measure, while SEO compounds over time. In our documented engagements, Google Ads typically produced results in 2 to 3 months, and ecommerce SEO in 3 to 6 months. Our SEO vs PPC guide walks through the choice.
How often is this page updated?
We review this page after every quarterly earnings season for Alphabet, Microsoft, Amazon and Meta, and we rebuild it each January for the new year. Every change is listed in the changelog, and the updated date at the top only moves when the data changes.
Can I use these statistics in my own article?
Yes. Please name the original source shown next to each statistic and link to this page as the place you found it. Our own figures, such as the Google Ads and Microsoft Ads CPC data, should be credited to Hustle Marketers with a link to this page.
What ROAS does each Google Ads campaign type deliver?
In our 22-account study published on Zenodo, ecommerce brand Search returned a median 16.44x ROAS, standard Shopping 5.62x, Performance Max 4.95x and non-brand Search 3.09x, from October 2025 to September 2026. Samples per campaign type are small and come from one agency, so set your own target from your margin rather than from these medians.
How much of a Google Ads budget goes to Performance Max?
In the 75 businesses we manage, Performance Max took 48.2% of Google Ads spend, and 55.7% in ecommerce, from September 2025 to September 2026. Our separate 22-account Zenodo study found a median 53.1% share of spend in ecommerce accounts. Lead generation accounts leaned on Search instead, with non-brand Search taking a median 49.2% of spend.
Sources
- IAB/PwC Internet Advertising Revenue Report, Full Year 2025 (April 2026)
- IAB, 2026 US ad spend forecast (September 2026)
- WPP Media, This Year Next Year 2026 Midyear Forecast (June 2026)
- Alphabet Form 10-K, FY2025, revenue by type (February 2026)
- Microsoft Form 10-K, FY2026 (July 2026)
- Amazon Form 10-K, FY2025, revenue disaggregation (February 2026)
- Meta, Fourth Quarter and Full Year 2025 Results (January 2026)
- StatCounter, Search Engine Market Share (September 2026)
- WordStream, Google Ads Benchmarks 2026 (September 2026)
- LocaliQ, Search Ad Benchmarks for Home Services (July 2026)
- Skai, Q2 2026 digital trends (July 2026)
- Tinuiti, Digital Ads Benchmark Report Q1 2026
- Pew Research Center, AI summaries and clicks (July 2025)
- Seer Interactive, AIO Impact on Google CTR: 2026 Update (April 2026)
- Ahrefs, AI Overviews Reduce Clicks by 58% (February 2026)
- SparkToro, zero-click searches in 2026 (June 2026)
- Google, Introducing AI Max for Search campaigns (May 2025)
- Google, 2025 Ads Safety Report (April 2026)
- Lunio, Global Invalid Traffic Report 2026 (vendor data)
- Google Economic Impact, methodology
- WordStream, Facebook Ads Benchmarks 2026 (September 2026)
- Meta, Third Quarter 2026 Results, Exhibit 99.1 (October 2026)
- Hustle Marketers, Google Ads account data from 52 accounts, 11 September 2025 to 10 September 2026 (first-party, anonymized)
Benchmarks tell you what is normal. Your account tells you what is possible. We compare your CPC, conversion rate and cost per lead with the figures on this page. Get Free Audit Worth $500